Diving into the Security Analyst’s Mind
At SpecterOps we provide consulting services, but we also get the opportunity to teach training. Our training courses are offered in two formats, public and private. In our public training offerings, we allow students to buy an individual seat for the course. For private trainings a company will bring us in to teach the course for their entire team. From the instructor perspective both options have their pros and cons. Public trainings are fun for us because we get to think about problems from many different perspectives as we have a very diverse student set, but private trainings really offer us an opportunity to dig deep into discussions about the client’s specific situation.
A couple weeks ago, Richie Cyrus, Brandon Scullion, and I had the opportunity to teach our Adversary Tactics: Detection class privately. Our class focuses on teaching students our methodology for creating robust detections. To provide students with an opportunity to build experience with the methodology, we provide them with a scenario and an associated lab environment. The scenario focuses on describing the notional company that the students work for and also goes on to describe a threat group that has been targeting other companies in the same sector. We provide a threat report for this threat group and students asked to synthesize a threat report by correlating the narrative with techniques in the MITRE ATT&CK Framework. Once they have identified what techniques this threat group has used in previous breaches, they have the opportunity to build and test detections for these techniques in the lab. As many readers are aware, detection is much easier in the lab than it is in production. For this reason we challenge students to be critical of their process and ask themselves how they arrived at their detection. Was it something that could translate to the real world or were they successful because it was a smaller lab environment?
During this particular course, we stumbled upon a really interesting use case that I’d like to highlight. This post focuses on the process of creating a detection, specifically the questions that a particular analyst had as he worked through it. I think it is extremely valuable to not only provide detection guidance, but to explore the thought process that analysts go through to create those detections. Through this analysis, we can learn tips and tricks from other’s process, as well as, identify where their process can be made more robust.
Looking for Evidence of Remote Services Abuse
To foster collaboration, students are grouped in teams of four and encouraged to work together (especially in private training classes). In this recent class, one team was interested in detecting Lateral Movement specifically focusing on the Remote Services technique. This is where attackers abuse remote administration protocols to move laterally through the network. Although the wiki article for the technique only lists Telnet, SSH, and VNC, it stands to reason that this technique can be expanded to include other common remote protocols like RPC, WMI, and WinRM. Let’s follow the analysts as they created their detection for this Lateral Movement technique.
Digging into the data
The first question the hunters wanted to answer was “what data source can we use to detect this activity?”. They decided to reference the Remote Services technique wiki page which provides an idea of what data sources can be used to detect this technique. It is important to note that the Data Sources section in ATT&CK is a best effort list and should not necessarily be considered comprehensive.
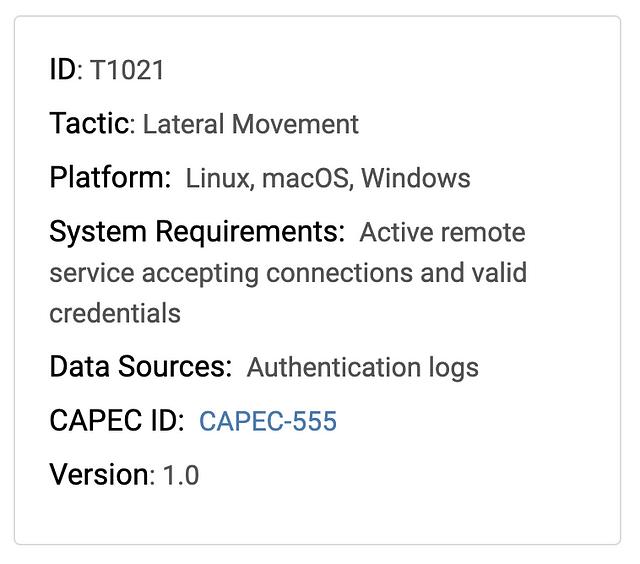
According to ATT&CK, this technique can be detected using “Authentication Logs”. The analysts immediately decided to start looking for Event ID 4624 from the Windows Security Event Log since they knew these logs were related to authentication. 4624 events specifically track all successful logons which the team thought would be helpful for this detection. To get an idea for what they were dealing with, they decided to start by casting a wide net and querying for all logon events.
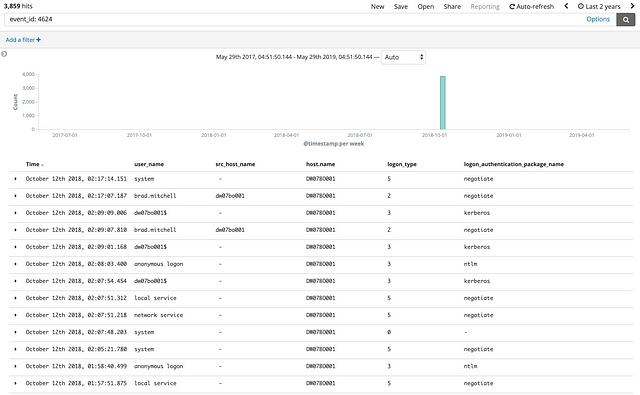
This initial search resulted in 3,859 individual events in the lab environment. Keep in mind that a real world network would likely have many many more logon events. As we know, logon events are definitely not malicious by themselves, so their next step was to think of a way to be more specific in their search to narrow in on malicious activity.
Next the team decided to dig into the data a bit deeper and referred to Roberto Rodriguez’s OSSEM project to identify what fields are available in 4624 events. They could use this understanding to decide the best way to narrow their search.
In case you aren’t familiar with it, the OSSEM Project provides an open source and standardized model for security focused events. One of the really useful components of OSSEM is the data dictionary section which strives to provide documentation of the different events that are available through security monitoring tools like EDR.

One field that drew interest was the logon_type field which is described by OSSEM as “the type of logon which was performed”. A bit more research resulted in a list of possible values for this field. After referencing OSSEM and reading about the different logon types, the analysts decided to focus on “Network” (Type 3) logons.
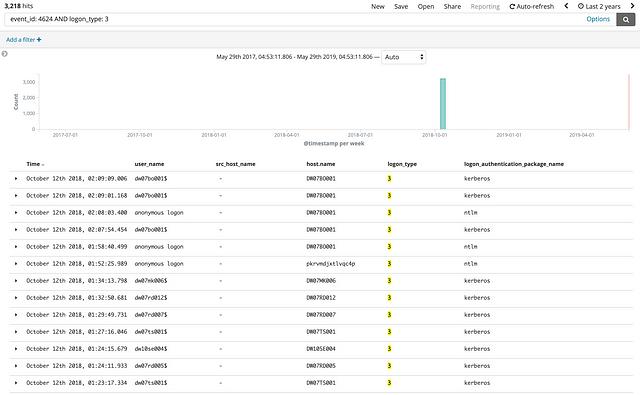
By excluding all non-network logon events, the team was able to reduce the number of events to 3,218. This number is lower, but still probably too high to either check manually or to declare as malicious. Again, a network logon is not malicious by nature, so we must find a way to be more intentional in our query.
At this point, the hunters reviewed the network overview that was provided to them at the during the scenario section at the beginning of the course. They found that the local administrator account (testadmin) had a shared password across the entire network. They hypothesized that an attacker would likely use this local administrator account to move laterally.
It is important to note that by making this assumption the students were likely excluding instances of Remote Service abuse. Sometimes our data or analysis capability forces us to purposely make exclusions (assumptions) to allow us to draw analytical conclusions. These assumptions should be documented and addressed through a separate detection later on.
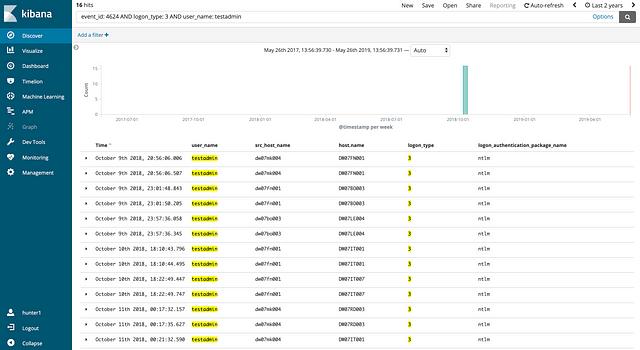
As a result of this decision they added the testadmin user name to their search query:
I think we found the lateral movement, but I can’t explain how…
Upon narrowing the result to 16 events, the students called me over for the first time to talk through their process. They explained their thought process that helped them arrive at their current situation, and they told me that based on other knowledge of the lab they were quite certain that they had found bad activity. The problem that they were facing was that they weren’t confident in this specific detection. One of the students even said, “I think we found the lateral movement, but I’m not comfortable just turning this over to an investigator because we don’t have any supporting evidence.”
They were right, they found bad activity, but their discovery was mostly based on luck and the fact that they were analyzing a lab environment which had less “legitimate” activity (noise) than a real world network would have. So how might they dig a little bit deeper to truly identify that this activity is nefarious? Is there a way for us to identify what happened with each logon event?
Learning about Logon Sessions
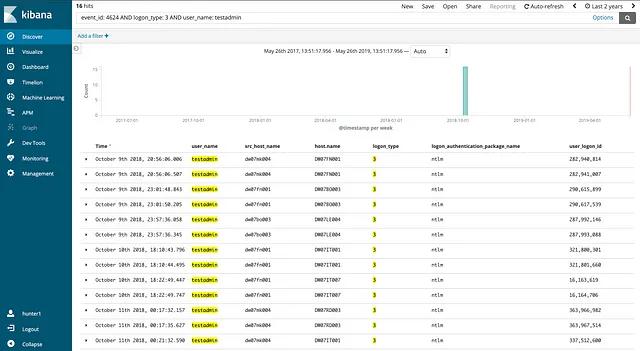
In our class, we spend time discussing important threat hunting skills. One skill that I find particularly important is a strong Operating System Internals background. In this case, understanding Windows Authentication would help us to identify that Processes are associated with Logon Sessions via their Access Token. This means that we can use the user_logon_id field in the 4624 event to identify what processes, if any, are associated with our suspicious logon event. We can then use these related processes to provide context around logon events which may allow us to determine if the logon event is indeed malicious. In the image below, I’ve included the user_logon_id field.
We decided to start working through each of the 16 logon events one by one to test our theory. Below is an image of what we found with the first logon event:

The first logon session was anticlimactic… There were only three events, none of which were process creation events. We initially didn’t know what event id 4672 was, so we referenced OSSEM once again to determine that it was a “Special privileges assigned to new logon” event. The same can be done with event id 4634 to identify that it is an “account was logged off” event. It looks like this logon session consisted of nothing more than a logon followed by a logoff and lasted less than 2 seconds.
The first logon session didn’t provide us with much value, but when we checked the second session we struck gold as shown below:
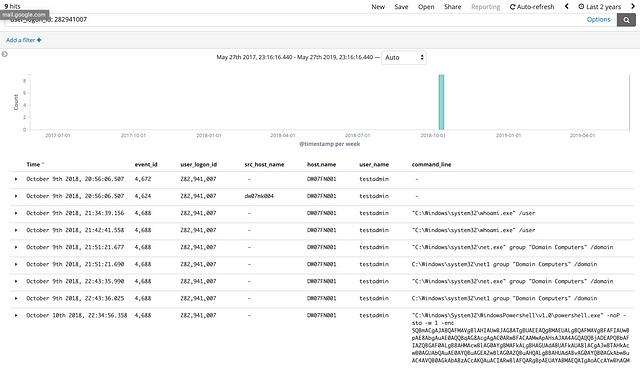
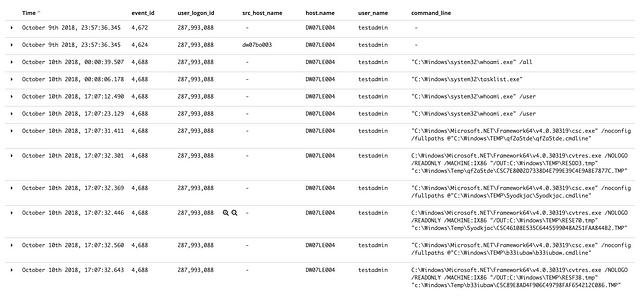
When we ran the query for user_logon_id: 282941007 Kibana returned the same 4672 and 4624 events we saw with the previous logon session, but it also returned seven 4688 events. A quick check with OSSEM showed us that 4688 events are “a new process has been created” events, so this means that each 4688 that we see was launched as part of this network logon session. A quick review of the command line arguments of these processes indicated that this activity was indeed malicious (whoami, group enumeration, powershell encoded command). Looks like we hit a home run on this one, so we continued our manual search looking for other malicious logon sessions.
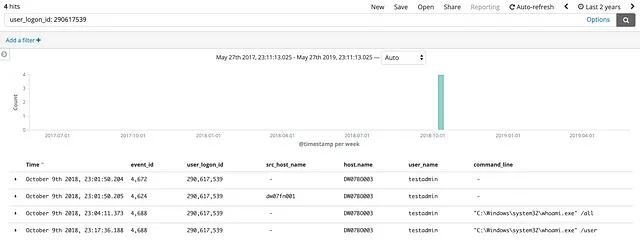
Below are images of the two additional logon sessions that spawned processes. Both logon sessions appeared to be malicious upon review of the command line arguments.
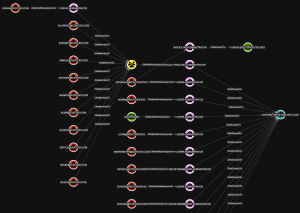
When it was all said and done we had three logon sessions that showed evidence of lateral movement. The remaining logon sessions don’t appear to be indicative of the Remote Services technique, but may or may not be related to some other malicious activity. The image below highlights the three malicious logon events.

This is cool and all, but can it scale?
At this point we felt like we had a pretty awesome win, but the reality began to set in. One of the student looked at me and said, “Ok, this was really cool and worked great in the lab environment, but our network has thousands of endpoints with countless logon events. This process was very manual, so I don’t think this is something that we can do at the enterprise scale.” He wasn’t wrong. It is one thing to manually grind through 16 logon events, but hundreds of thousands would be untenable. This type of manual analysis is more in line with “Investigation” work than “Detection” work, but initially we couldn’t think of any other way to filter the results down more.
This is where a data analyst can benefit from working with a data engineer. The student was correct, in its current state, our data and analytical tools do not provide an opportunity to make these “complex” correlations. However, the benefit of the exercise is to identify what is technically possible. We identified that processes are related to Logon Sessions and that we can correlate 4624 events to 4688 events. This correlation allows us to identify what processes were created within what Logon Session. Thus we can apply extra scrutiny to Network logons possibly revealing Lateral Movement within our environment. We can now take this use case to our data engineers (the people in charge of the data pipeline) and work with them to reduce the manual nature of the process that we just discovered. My colleague Roberto Rodriguez released a companion blog post that shows exactly how you can use Apache Spark and Jupyter Notebooks to enable more efficient analytical capabilities. If you are interested in learning more about how you can leverage your data to make the data analyst’s job easier, please check it out.