Introduction
Creating detections can be challenging. There often isn’t a “simple” way to detect something, and once we see an event that seems to correlate with the activity we are looking for, it is easy to become fixated. We create that detection and move on. However, what if other telemetry sources had helped provide a different context to that action of interest? Could we have created multiple detections with various telemetry sources to provide better coverage? If a telemetry source can be “evaded,” should we not use it?
I want to answer these questions by talking about telemetry layering as it relates to the operation — loading .NET assemblies. Telemetry layering is built within the detection section of the funnel of fidelity and ideally leads into detection layering (a subject for another day) that helps layer detection strategies on top of each other. Every detection has pros and cons, and these could be anything from the signal-to-noise ratio to an adversary’s patching a function so that logs aren’t created.
.NET Assemblies
.NET assemblies consist of managed code and are the building blocks of any .NET application. They can come in the form of EXEs or DLLs. Using .NET allows for the following:
- Every Windows machine comes with some pre-installed .NET version. Check out this link by Microsoft to check out the default installed versions.
- .NET is managed so you don’t have to worry about memory management.
- Assemblies can be loaded into memory, so you don’t have to drop a file to disk — i.e. executes in memory.
- Microsoft has incorporated a lot of libraries into the .NET framework that solve a lot of common programming tasks for developers like HTTP connections, cryptography, inter-process communication (IPC) (like named pipes).
Due to the reasons above a lot of offensive tooling is written in .NET and attackers like to opt-in to this capability. Which is why Cobalt Strike capabilities like execute-assembly and InlineExecute-Assembly exist.
The Operation
The operation that we are going to look into is when someone loads a .NET assembly. There are various native ways this can be done. Let’s show a couple:
PowerShell:
Add-Type -TypeDefinition ‘public class Foo {}’
.NET:
[System.Reflection.Assembly]::LoadFrom(“C:Example.dll”)
Obviously there are other .NET class methods like [System.Reflection.Assembly]::Load that could be used, but this blog isn’t a write-up on how loading an assembly works. If you are interested in this type of information I found the following blogs insightful:
- Investigating .NET CLR Usage Log Tampering Techniques for EDR Evasion by bohops
- Don’t Be Rude, Stay: Avoiding Fork&Run .NET Execution With InlineExecute-Assembly by @anthemtotheego
Telemetry Layering
The last bit of my research after looking into any operation that I want to make a detection for is to identify the appropriate telemetry that can be used for a detection rule. Once that is done, how do I pick the appropriate telemetry source to use for a detection rule? What are its pros and cons? Can it be evaded in some way? Now, unfortunately, there is going to be some assumptions that will have to be made before moving forward:
- We have tracked the operation to the telemetry sources below
It is possible to validate, through code analysis, whether an event will be generated for when a target operation is executed. Unfortunately, that will take away from this post a little bit, so we will skip over it.
Telemetry Source 1: AMSI
When looking into loading a .NET assembly, there are a couple of avenues to obtain visibility into this operation. One is through an ETW provider called Microsoft-Antimalware-Scan-Interface (AMSI). A lot of EDR’s have been using this data to pick up telemetry. We aren’t going to dive into all of the benefits of the AMSI event source and its inter-workings. Matt Graeber and Jimmy Astle have already done this for us in their blog: Better know a data source: Antimalware Scan Interface. AMSI provides a lot of great information, but the two we will focus on are:
- Appname — Application that submitted content to be scanned
- Content — For .NET this will be the PE contents of the .NET assembly that was loaded into memory
Great! Let’s see what this looks like:
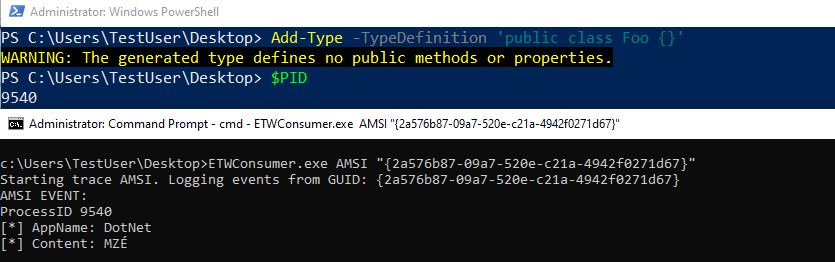
This seems like a nice event to use (assuming our vendor collects it), we see that a .NET assembly was loaded, the ProcessId where the .NET assembly was loaded, but the content doesn’t seem to be very helpful. As Matt and Jimmy mention in their blog this is supposed to be the PE contents of the .NET assembly. Though the content is helpful, there might need to be some additional manipulation to figure out what is in those contents.
As some might know, AMSI can be patched. This is done by patching out the AmsiScanBuffer function before loading .NET (and others) code. This is common in a lot of CobaltStrike profiles. An example is threatexpress malleable-c2 repository. Although we are not trying to detect CobaltStrike’s execute-assembly or other capabilities that allow for the loading of .NET code, it is important to know that this patching capability exists. The next logical step would be to try and identify another source of telemetry for our detection(s).
Telemetry Source 2: DotNetRuntime
Another ETW provider that stands out when it comes to .NET activity is Microsoft-Windows-DotNETRuntime. Using Pavel Yosifovich’s EtwExplorer tool it can be quickly seen that there are events related to .NET assembly loads.
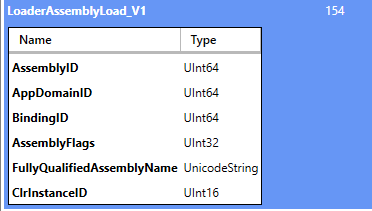
Let’s create an ETW event trace session to capture these events and load up a custom .NET assembly and see what the events look like.
The information above shows that we can get the process that loaded the assembly and the assembly’s name that was loaded. If we wanted to see the methods that were loaded and executed, we could pull the LoaderMethodLoad events from the Microsoft-Windows-DotNETRuntime ETW provider.
However, there is a potential issue with this approach. Adam Chester talks about his blog Hiding Your .NET — ETW where he talks about patching out the EventWrite function. This function is in charge of writing events to a provider. This causes issues because we now wouldn’t see events from either AMSI or .NET. As they are both backed by ETW. Let’s take a look at this and use CobaltStrike and Inline-ExecuteAssembly as an example.
Below I ran:
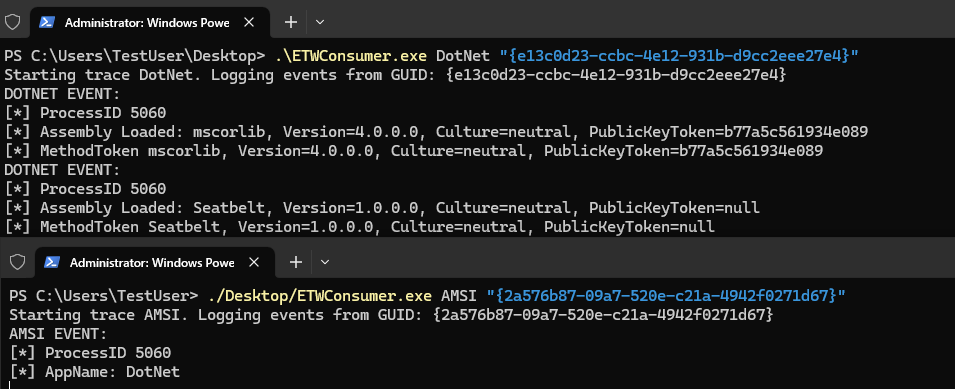
inlineExecute-Assembly — dotnetassembly /home/ — dotnetassembly /home/TestUser/Seatbelt.exe — assemblyargs group=system
We can see that after execution I get event’s in ETW for both .NET and AMSI.
When I use the –etw argument with inlineExecute-Assembly (which patches the EventWrite function) we can see that no events are created.
inlineExecute-Assembly — dotnetassembly /home/TestUser/Seatbelt.exe — assemblyargs group=system — etw
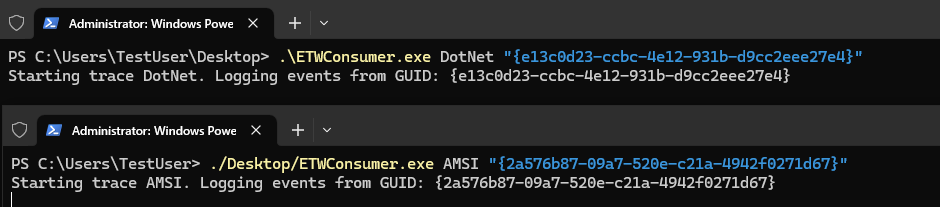
Note: The GUIDs provided above relate to the ETW provider GUIDs of the Microsoft-Windows-DotNETRuntime and Microsoft-Antimalware-Scan-Interface.
Now we have encountered two different telemetry sources which would yield good results for detection but can be evaded by patching the appropriate functions to properly log those actions. This isn’t bad, but we want to look for another source of telemetry that we could use for a detection.
Telemetry Source 3 — .NET DLL loads
The last approach we will look at for this write-up is the loading of .NET-based DLLs. This could be a loud approach for detection; however, we are not worried about that quite yet as this is the telemetry identification phase. There are many DLLs that get loaded when a .NET assembly is to support execution of the .NET code. We will look at clr.dll (Microsoft .NET Runtime Common Language Runtime — WorkStation) and mscoree.dll (.NET Runtime Execution Engine). If we know that these DLLs are loaded into any process that executes .NET code, then we can look for these DLLs being loaded. Event ID 7 within Sysmon provides information about the loading of DLLs. Let’s execute the same inlineExecute-Assembly command as we did above.
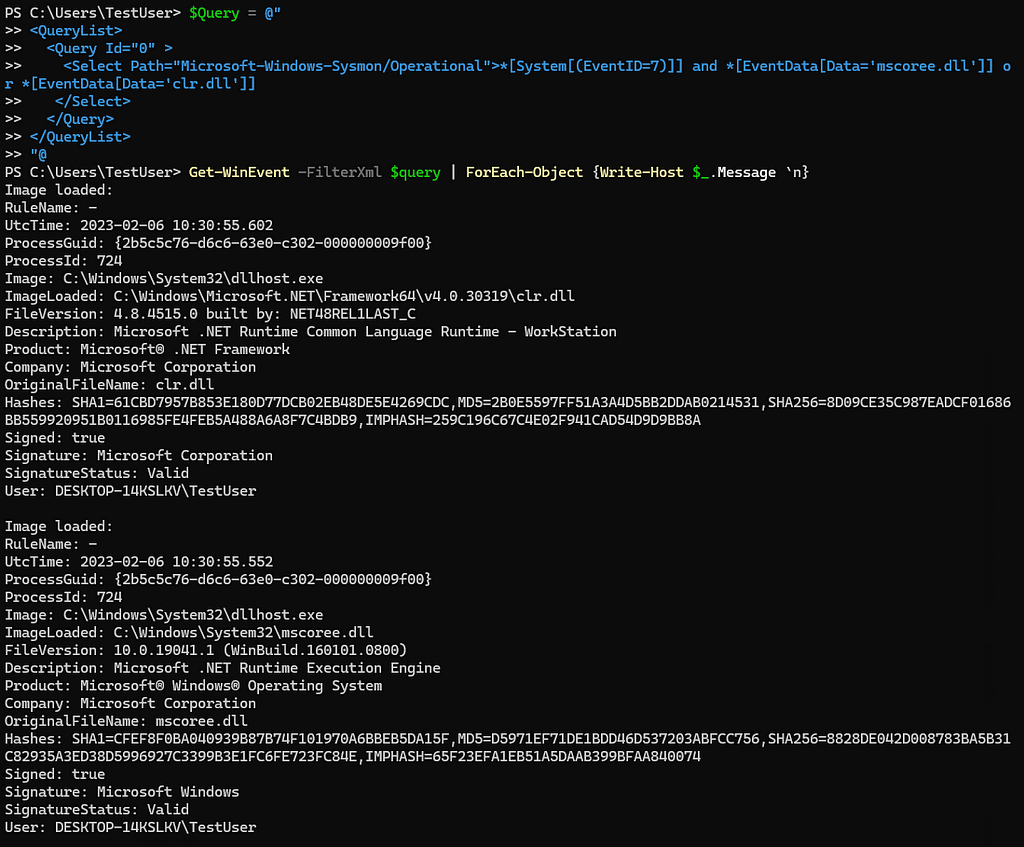
Great, we were able to see both DLLs loaded into the same process. This data we can rely on regardless of if someone were to attempt to patch ETW or AMSI.
Now we have identified a third telemetry source we can use for our detection, one that can be relied on and will trigger anytime someone tries to execute .NET code. Does this mean we should use this source for our detection? Why not use all three?
We won’t walk through creating a detection with these events in this write-up. This will be covered in a later one when we touch on detection layering. However, it is easy to skip or forget telemetry sources because of their ability to be evaded or blocked from being written. That doesn’t mean they don’t serve a purpose and should be forgotten. Each one of the telemetry sources shown today have their pros and cons.
Telemetry Source 1: AMSI — The AmsiScanBuffer function can be patched when loaded from amsi.dll. As a result, events won’t get written. However, if this patch doesn’t happen, we get a byte array of the PE context. This is helpful from a detection perspective because yara rules could be ran over the content, making the value of this source high.
Telemetry Source 2: DotNet Runtime ETW — The EventWrite function can be patched when loaded from ntdll.dll. However, if it isn’t patched, we get the assembly name that was loaded and the different methods that were loaded as well. Although adversaries have control over the assembly names, if we are able to pick up on known bad/suspicious assembly names this is an easy win within our detections, making the value of this source medium.
Telemetry Source 3: .NET DLL loads — Although potentially loud, we can see the processes loading these DLLs. We can’t validate that .NET code was actually executed, but we know that it could. This source might not be the most cost effective (something we will touch on in a later write-up) because a lot of processes run .NET code. However, there are strategies that can help with this — additional context within the triage section or a candidate for Machine Learning (ML).
Just because a telemetry source has cons doesn’t mean it shouldn’t be leveraged for detection. As researchers we must give the proper information regarding the value of a telemetry source to our detection engineers/organization so that they can decide the proper sources to leverage for detections. If we limit the capabilities within the identification phase, then we inherently limit detection capabilities. However, layering these sources together leads to detection layering, which results in better and more confident coverage.
Conclusion
When identifying which telemetry source should be used for detection, it is easy to become fixated on one event. This could be because someone else has said to use this source because you have identified it relates to the operation you are looking for or because of fear of the false positives it would bring in a detection. However, this inherently creates limitations on detection capabilities.
In a future post, I plan to go more in-depth on detection layering and how to approach the problems of going from a precise detection to a broader one without fear of false positives.
Appreciation
Thank you to Jared Atkinson and Matt Graeber for reviewing this post.
Telemetry Layering was originally published in Posts By SpecterOps Team Members on Medium, where people are continuing the conversation by highlighting and responding to this story.