Threat Intelligence ETW
Not all manifest-based Event Tracing for Windows (ETW) providers that are exposed through Windows are ingested into telemetry sensors/EDR’s. One provider commonly that is leveraged by vendors is the Threat-Intelligence ETW provider. Due to how often it is used, I wanted to map out how its events are being written within TelemetrySource.
This post will focus on the process I followed to understand the events the Threat-Intelligence ETW provider logs and how to uncover the underlying mechanisms. One can use a similar process when trying to reverse other manifest-based ETW providers. This post isn’t a deep dive into how ETW works, if you’d to read more on that I suggest the following posts:
- Tampering with Windows Event Tracing: Background, Offense, and Defense
- Data Source Analysis and Dynamic Windows RE using WPP and TraceLogging
Threat-Intelligence Provider
The Threat-Intelligence (TI) provider is a manifest-based ETW provider that generates security-related events. The TI provider is unique in the sense that Microsoft seems to continuously update this to provide more information around operations that would take some extreme engineering to obtain (i.e. function hooking) in the kernel. We will take a look at this later when we look into how the TI provider logs operations around writing code to a process’s memory. As we can see below, the TI provider provides a lot of unique events:
https://medium.com/media/f80b3191ab3853c3d2eb97cf4f0f158e/href
The TI provider is also unique as you need to be running as a PPL process in order to log events. Not sure why Microsoft made the decision to prevent logging from non-PPL processes, but this isn’t much of an issue as it is the standard for vendors to run their service binaries as PPL now. This is why tools like Sealighter-TI exist so that others can log events from this provider. You can also change the Protection Level of the EPROCESS structure within WinDbg too. If you want to learn more on PPL I highly suggest Alex Ionescu’s series: The Evolution of Protected Processes.
Let’s take a look at how one of these events are logged!
WriteProcessMemory
ETW Provider Registration
The TI provider logs events in the kernel, so to track down how events are tracked we will need to look at ntoskrnl.exe. We will use IDA to analyze code within ntoskrnl.exe.
Anytime a program wants to write to an ETW provider it has to call either EtwRegister (kernel-mode) or EventRegister (user-mode). Because the TI provider emits event from the kernel, we will look for EtwRegister. Looking at the cross-references for EtwRegister then we come across a function EtwInitialize. This function registers many ETW providers seen below.

Let’s break down EtwRegister’s function:
NTSTATUS EtwRegister(
  [in]           LPCGUID            ProviderId,
  [in, optional] PETWENABLECALLBACK EnableCallback,
  [in, optional] PVOID              CallbackContext,
  [out]          PREGHANDLE         RegHandle
);
The first value being passed in is a pointer to the ETW Provider GUID. We can see this by double clicking on ThreatIntProviderGuid and seeing the following value which aligns with the ETW TI GUID f4e1897c-bb5d-5668-f1d8–040f4d8dd344:

We then have 2 other parameters that we will skip for now as they don’t hold a lot of relevance right now.
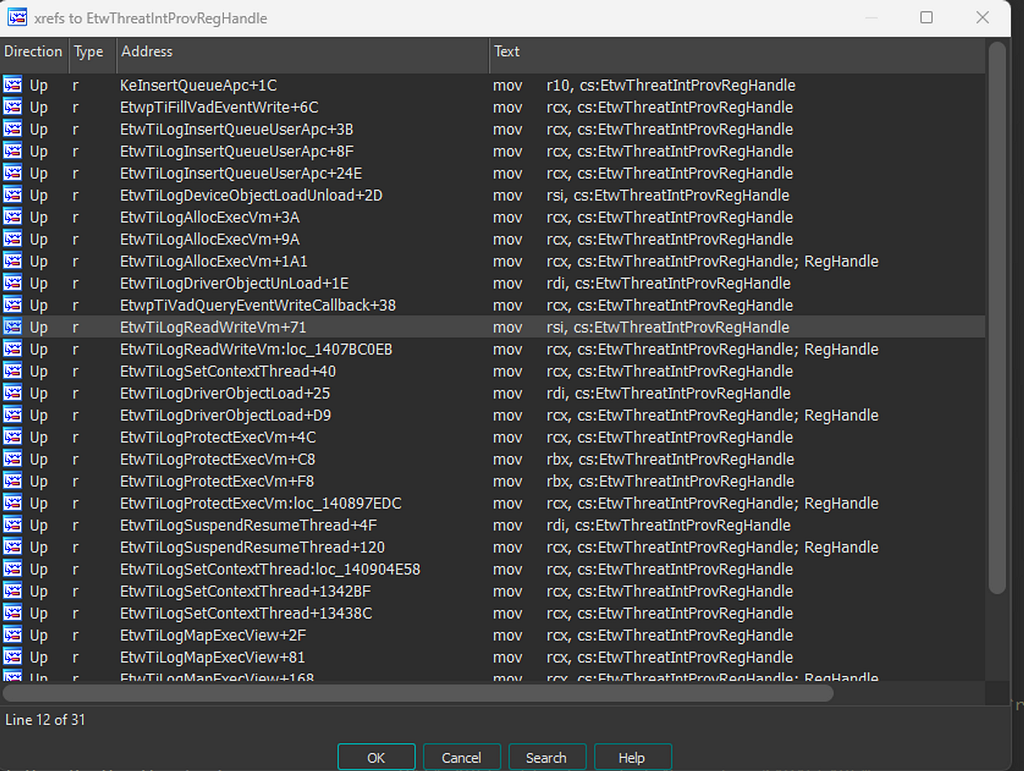
The 4th parameter is an output parameter that returns a handle to the registered ETW provider. This gets passed into functions like EtwWrite so that the function knows what provider to write to. We can double click on this registration handle then cross-reference it within the code to see who calls it. Any function we see that calls it, outside of this one, is most likely writing an event to the TI provider:

Because we are taking a look at operations related to writing to a process’s memory the Function EtwTiLogReadWriteVm looks interesting. This call eventually makes a call to EtwWrite.
The following is how Microsoft defines EtwWrite:
NTSTATUS EtwWrite(
  [in]           REGHANDLE              RegHandle,
  [in]           PCEVENT_DESCRIPTOR     EventDescriptor,
  [in, optional] LPCGUID                ActivityId,
  [in]           ULONG                  UserDataCount,
  [in, optional] PEVENT_DATA_DESCRIPTOR UserData
);
The first parameter is our registration handle which we got from EtwRegister.
The second parameter is a pointer to the EventDescriptor, which is defined below:
typedef struct _EVENT_DESCRIPTOR {
  USHORT    Id;
  UCHAR     Version;
  UCHAR     Channel;
  UCHAR     Level;
  UCHAR     Opcode;
  USHORT    Task;
  ULONGLONG Keyword;
} EVENT_DESCRIPTOR, *PEVENT_DESCRIPTOR;
We can see the different members of this structure, one being the EventId (seen as Id) of the event. Within our code we can see EtwWrite called like the following:
result = (struct _KTHREAD *)EtwWrite(
    (PREGHANDLE)EtwThreatIntProvRegHandle,
    (PCEVENT_DESCRIPTOR)v15,
    0i64,
    v28 + v29,
    &UserData);
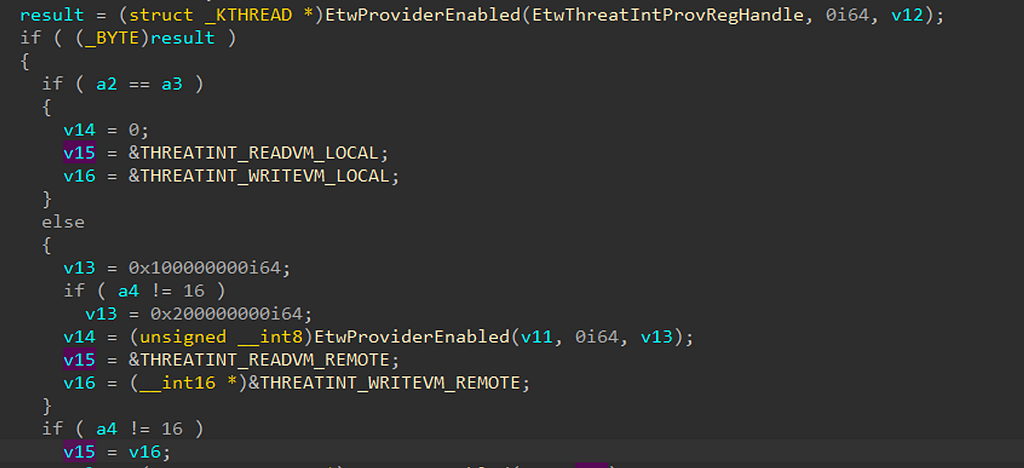
The second parameter is what we want to follow back to get the proper eventId being passed to EtwWrite. If we follow v15 backwards we will come to the following:

This code block is saying — if EtwProviderEnabled (registered and enabled to be logged), move on. Then we see another IF statement saying if (a2 == a3), which if followed back is checking to see if the process that is being read/written to is the same as the current process then v15 is THREATINT_READVM_LOCAL and v16 is THREATINT_WRITEVM_LOCAL. otherwise (if the process being written to/read from is different from our current process then the values point to different EventDescriptors THREATINT_READVM_REMOTE / THREATINT_WRITEVM_REMOTE.
Lastly, there is another if statement saying if a4 is != 16 or not and will set v15 to v16 if it isn’t. What is this 16? If followed back this is the decimal value of the access rights that were requested from calls NtReadVirtualMemory and NtWriteVirtualMemory, which are hardcoded in the function MiReadWriteVirtualMemory that both those functions call. If you look here.
It can be seen that PROCESS_VM_READ is 0x10 and PROCESS_VM_WRITE is 0x20, converted into decimals. We can see that those transfer to 16 and 32. So the call is seeing which access was requested to check which function to write.
To identify the EventId for THREATINT_WRITEVM_REMOTE let’s move forward in the assumption that the desired access is 0x20/32 (Process write operation) and the process being read from isn’t the local process. How do we know what event THREATINT_WRITEVM_REMOTE relates to? THREATINT_WRITEVM_REMOTE is a pointer to an EVENT_DESCRIPTOR:

We can see the first member is the Id of the event which is a value to hex 0x0e, which when converted is 14. The keyword mask if someone wants to log this event specifically in their consumer is 0x8000000000008000.
Now that we have tracked which event THREATINT_WRITEVM_REMOTE writes to wwe want to figure out how this event is logged. We do this by finding the function calls that end up callingEtwTiLogReadWriteVm and pass on the 0x20 value so that it can be logged correctly. This leads to MiReadWriteVirtualMemory. The code in this block is not necessarily useful for our current purpose. There are 3 functions that callMiReadWriteVirtualMemory:
NtReadVirtualMemoryEx, NtReadVirtualMemory, NtWriteVirtualMemory.
If we go look at the NtWriteVirtualMemory function we see that it passes 0x20 as the last parameter to MiReadWriteVirtualMemory:

So, we can confirm that if there is a user-mode function like WriteProcessMemory that eventually calls NtWriteVirtualMemory theTHREATINT_WRITEVM_REMOTEevent will be logged. The other 2 functions relating to reading a process’s memory passes in 0x10, which funnels to the READVMevents.
Conclusion
As I map out how telemetry is collected for various sensors and mechanisms, I think it is important to expose this process for anyone else undertaking a similar endeavor. Understanding the telemetry that is being leveraged by so many vendors is beneficial from a defensive perspective, as it will help us evolve capabilities. Whether that be how we leverage this data or to push vendors to use this data more to help cover gaps in our organization.
I hope you enjoyed this walk-through. If you have any questions, feel free to reach out!
Uncovering Windows Events was originally published in Posts By SpecterOps Team Members on Medium, where people are continuing the conversation by highlighting and responding to this story.


