Beyond Procedures: Digging into the Function Call Stack
Within the cybersecurity industry, many of us have a natural inclination towards digging into technical concepts and understanding what is going on under the hood. Or, if you are like me, you develop this over time and realize many of the complexities and dependencies you had missed, resulting in a desire to dig in and figure out what is going on. I have found this to challenge assumptions and force a break in perspective that I think is healthy for an analytic mindset.
Most recently this has meant an interest in digging into what lies beneath the level of “Procedure.” For many of us, the MITRE ATT&CK matrix has presented the conceptual model of how adversary tradecraft works. You have Tactics, Techniques, and Procedures (TTPs), and these account for the motives, actions, and methods used by adversaries in accomplishing their malicious objectives.
If you are like me, you may have stopped at that “Procedure” level, not taking the full time to dig into all the intricacies. In my own fixed mindset, I poorly assumed that was as deep as I needed to go. I have come to realize there is a blatant fallacy in that mindset, as such mindsets can fuel the development of detections and defensive methodologies that focus on more static indicators of compromise (IOCs). Once we start to look under the hood of the “Procedure,” however, we realize that there is a whole stack of activities going on. In this case, that is the function call stack which Jared Atkinson talks about in his blog, Understanding the Function Call Stack.
In my case, this seemed a little daunting at first. I had never dug into these concepts, and I was worried I had to learn a lot of other things before being able to do so. This, too, was a faulty assumption. I recently had the opportunity to start working with analyzing a couple of different tools in the methodology he lays out in that blog, and my goal here is to present an overview of how I approached this as well as a methodology you can use for basic analysis of the function call stack. Once you are able to do this, I am certain you will uncover a whole new layer of concepts worth digging into and understanding towards the goal of demystifying adversary tradecraft.
As an administrative note, this blog is written so you can follow along as I guide you through the steps. I will conclude with a step-by-step methodology as a quick reference. And should you choose to follow along, I have also compiled a Requirements section at the foot of this blog for your convenience.
Let’s begin!
Getting Started
I originally struggled with the idea that I had to have a lot of deep-seated prerequisite knowledge to be able to start digging into the function call stack. While this is not true to the level I originally figured, I do believe you should at least understand a few things. First, familiarity with the function call stack as it is discussed in the previous blog link is a great starting point (you do not have to understand every detail, but you should be able to look at it and have an idea of what is going on conceptually). Second, you do not have to be an expert programmer, but you should be familiar with reading some code — knowing the flow, variables, different statements (if-then, else, etc.) is important. And of course, you must be willing to learn as you go. Things might not make sense at first, but as you dig in, read documentation, look at the code, analyze the connection between functions — things will start to connect and make more sense.
For this effort, I decided I would use a fairly straightforward tool for my analysis. Within Powersploit’s Privilege Escalation module there is the PowerUp script written by Will Schroder, which includes a function called Get-ProcessTokenPrivilege. This function is not necessarily malicious by itself, but it had what I needed to better understand the methodology for analyzing the function call stack.
For context, Get-ProcessTokenPrivilege is a PowerShell function that returns privileges for a current or specified process ID. So, an attacker might use this to determine what the privileges are for the process they are using, or for a process they may want to pivot to. It does this by opening a handle to the process, opening the process token, querying the token’s information, and then closing the handle to the token. It is slightly different if you are querying the process you are in (pseudo-handle vs regular handle), but otherwise the same.
For this analysis, we are going to look at one of those steps and understand what is happening under the hood. This analysis will be straightforward and should give you a decent understanding of what the function call stack looks like as you dig into a single function. Note that I do not repeat these steps for each function, as this is redundant for this tool.
OpenProcessToken
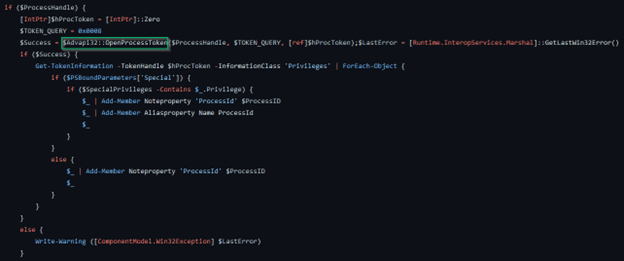
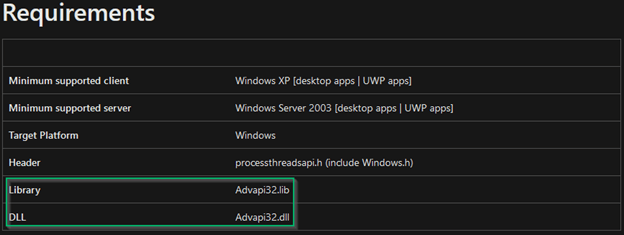
Above I have depicted a portion of the PowerUp code. Now, if you are following along, you will notice that I have started at a later function in Get-ProcessTokenPrivilege, opting to start with OpenProcessToken rather than OpenProcess. If you would like, you can follow along here, or start at the beginning (OpenProcess) and go from there — I will provide the guidelines to do both, as there is minimal difference between the two. In any case, what you see above is the code block in the PowerUp script where OpenProcessToken is being referenced. To provide some context, this is the point where a process handle has been retrieved (note the `IF` statement at the top checking the validity of the process handle) and is passed into the function on the line annotated with a green square ($Advapi32::OpenProcessToken). Now, for the purpose of digging into the function call stack, we will not worry about everything you see listed here. It is the specific OpenProcessToken function we are interested in. A helpful bit of contextual information we also have here is that there is an explicit declaration of the dynamic link library (DLL) that OpenProcessToken is exported from — Advapi32. I will note that you will not always see reference to the DLL, so in cases where you only have the function, it is good to look at the API documentation which will have a requirements table listed. In this case, that is OpenProcessToken which confirms Advapi32 as the exporting library.
With this in mind, we need to look at this referenced library and figure out what’s actually happening under the hood. For this, we will need a software disassembler — I use IDA (though you can also use Ghidra). A couple notes, however: make sure you open IDA as an administrator, otherwise you will run into issues when loading the DLL; and Advapi32 is located in C:WindowsSystem32 which is where you will have to go when prompted by IDA.
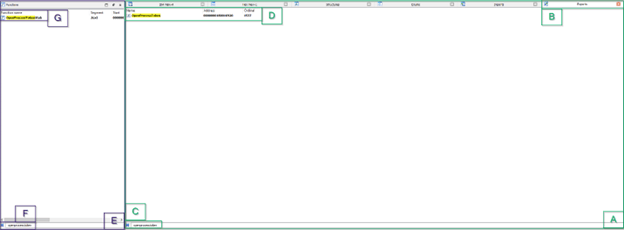
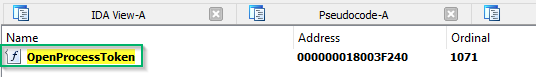
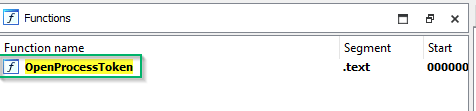
Once you have IDA open, you should validate that you can see the function you’re looking for. This is done on the bottom right-hand side of IDA (A), where you can look at the Exports tab (B), CTRL+F and type in the function name ©, and the function should display at the top (D). Of course, this function’s documentation noted that its module is advapi32.dll, so it should also show up in the Functions window on the left-hand side (E). If you look, you’ll notice it doesn’t (F, G). Instead, you have OpenProcessTokenStub. This is okay and won’t hurt your ability to continue analysis. Simply double-click the OpenProcessToken in the Exports tab and it will take you to the function in the disassembled output.
Selecting it should lead you to the IDA View-A window displaying the following:
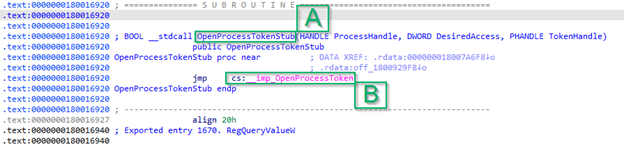
What’s interesting here is that the process we see is not actually OpenProcessToken, but OpenProcessTokenStub (A, similar to what we saw in the last step in the Functions window). And the only reference to OpenProcessToken is below, where it references __imp_OpenProcessToken (B).
This is interesting, as this is a further indicator that OpenProcessToken is not native to advapi32.dll. This is not unusual, though, and you’ll see this frequently when looking at functions. In this case, that `__imp_` portion is indicative of OpenProcessToken being an imported function. Which ultimately means…

From here, because it’s imported, you’ll have to go to the “Imports” tab and look for OpenProcessToken (another CTRL+F). When you do, you should get this output which may seem a little confusing:

Here you’ll see the library from which OpenProcessToken (A) is imported, which is listed as `api-ms-win-core-processthreads-l1–1–0` (B). This is what’s known as an API set, and unfortunately will not appear within your System32 folder as a DLL you can disassemble in IDA.
This is fine, though, since there’s still a way to get around this. Within James Forshaw’s NtObjectManager tool there is a cmdlet called Get-NtApiSet. Using the following command structure `Get-NtApiSet -Name <insert name of API set>` we can trace this API set to the “endpoint” DLL from which the original function is exported.
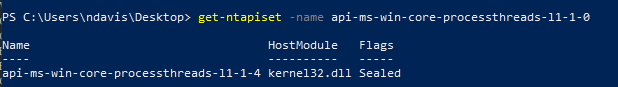
In this case, that’s kernel32.dll. Which means we should actually be looking in Kernel32 for OpenProcessToken. In this case, you can follow the same exact steps as previously mentioned to see what’s going on with OpenProcessToken. I won’t walk you through this exactly, so if you want to open up Kernel32 in IDA and do the same thing, feel free to go for the extra rep.
If you do this, you’ll find once again that it is exported, but doesn’t show up within the functions listed in the left-hand window I referenced above. Further, you’ll find that when you select it from the Exports tab, you get the following:

So, once again, we find that OpenProcessToken is imported from elsewhere. If you go to the Imports tab and look up OpenProcessToken, you’ll see something familiar:

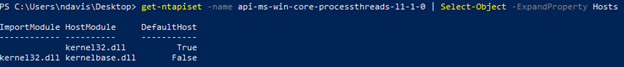
It’s imported from another API set. Which, if you’ll look closely, is the exact same API set as before. Now, from a previous step we know that api-ms-win-core-processthreads-l1–1–0 redirects to kernel32.dll as the host module. So now what? We have a function that’s imported, but the reference library is the same DLL that’s saying it’s imported. To get around this, we have to be able to access the objects from the Get-NtApiSet output that we used previously. Specifically, the `Hosts` object. Thus, our command changes slightly: `Get-NtApiSet -name <API set> | Select-Object -ExpandProperty Hosts`. What this does is expand the output, giving us a deeper trace on the API set tied to OpenProcessToken. Here we can see that instead of kernel32.dll, we have kernelbase.dll. Without going into too much detail, this happens with several different functions — they exist across multiple DLLs, and when this happens there is a primary DLL to which they point (in this case Kernel32). However, they may be further referenced as an imported function from that DLL, in which case there is a sort of “base” DLL from which they are imported (in this case, KernelBase). If it sounds confusing, it is. But if you’re really curious about the why behind this, there’s a Patent document that explains the concept in further detail.
From here, it’s a similar process to before. Open up IDA, throw kernelbase.dll in, and now you’ll see two things: OpenProcessToken will show up as an exported function (first image), and as a base function (second image):
You can select either one of these (as they will take you to the same line in the disassembly output). At this point you will probably see a text view, but you can also left click and select “Graph View” which will take you to a more visual output of the function (not pictured).
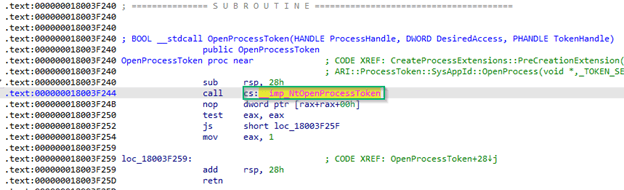
In either case, as we look at the function we can see it making a call to a separate function. In this case, the pink text highlights this call: `__imp_NtOpenProcessToken`. Again, that `__imp_` means that it is an imported function, so we need to go back to the Imports tab and search for this. In this case, however, we won’t have to worry about an API set as NtOpenProcessToken (A)is imported from NTDLL (B). As a side note, you may notice that when we look for NtOpenProcessToken we find a similar function (NtOpenProcessTokenEx) that appears to be related, albeit not in our function call stack. If you’re interested, I’d recommend digging into this function some more to see why it’s different, and in what situation it might be called instead of NtOpenProcessToken.

From here, we can open up ntdll.dll in IDA and do our final search. Once again, as before, we’ll see NtOpenProcess in both the “Exports” (A) and the Functions list (B):

Selecting this and opening it up (text or graph view is fine), we’ll see that this function makes one final call in the form of a “Syscall,” or System Call (green square):
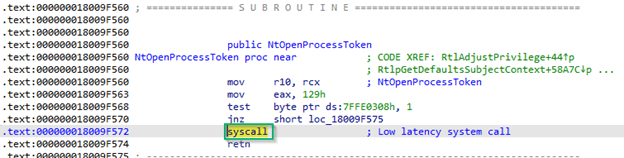
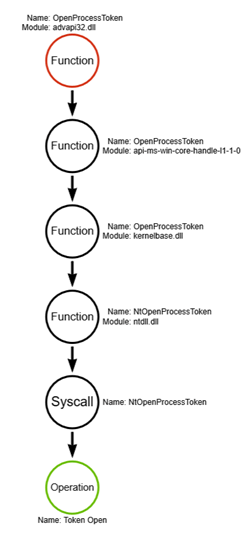
This syscall is the final step down the function call stack and represents the base level operation. In this case, we can call that operation “Token Open.” At this point, there are no further DLLs we have to keep digging into — this is as deep as we go for our analysis. Depicted graphically, this function call stack will look like this:
Now, if you’re like me, you might think that this whole process seemed excessive just to determine what’s happening under the hood. And it’s easy to think this when the original call is made to OpenProcessToken and the underlying syscall indicates that essentially the same thing is taking place. However, this is not the case for all Win32 APIs (more here), and as you take this knowledge and dig into other tools, you’ll find that there’s often more going on than just a simple process. Or a tool has different IF-ELSE statements that attempt multiple sets of operations in the pursuit of a particular objective. And these, of course, are what can differentiate a particular tool when it comes to understanding what the tool is doing under the hood. While I don’t go into all these variations, remember that this walkthrough is simply to equip you with enough knowledge to go and do this on your own. I know when I had the tools to do so, I started asking a lot more questions, I started doing a lot more digging, and I started learning much more about the intricacies of the function call stack.
If you’ll recall, of course, there are still more Win32 APIs that are referenced within the function. As I said, I won’t explicitly walk through these as the directions here would only be repeated multiple times over for roughly the same process. That said, should you decide to go through all of them, you’ll find your final product to look similar to this:
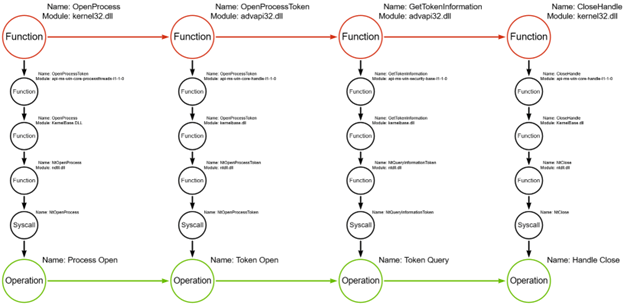
If yours looks slightly different, this is an opportunity where I challenge you to go back and look at the PowerUp script to see why there’s a deviation. If you’re struggling, I’ll present the methodology I’ve learned that I hope you can also use when going through further iterations of analyzing the function call stack.
Methodology
For clarity’s sake, I present the general methodology I followed for this blog in a list format with minimal description. I make the assumption you’ve read through the previous section, so if you have a question about a step here, I do detail it above.
- Start with the tool you’re interested in looking at.
- Do a static analysis of the code — do you find any reference to Win32 APIs? If not, that’s okay, but you’ll have to do some digging into the functions to see what’s going on. An example of where you might see such an issue is a tool like Impacket, where functions are written in Python but eventually reference a function that you can then dig into for further analysis.
- Look at the documentation for the function and find the DLL that is associated with the identified function. While Microsoft doesn’t have everything documented, these high-level functions should be documented and include the DLL in the Requirements section.
- Pull up the DLL in IDA and pay attention to where you can look for your target function. There are three locations where you can and should look, in order: (1) Exports (tab, far right) — the function should always be in this list; (2) Functions (window, far left) — the function may be in this list; (3) Imports (tab, far right) — the function may be in this list, but you should verify what’s happening under “Exports” and “Function” first.
- When you find functions that make a call to an imported function (“__imp_”), look at the library they reference. This may be a separate DLL, but it may also be an API set with a naming convention like `api-ms-win-security-base-l1–1–0`, or something similar. If it’s another DLL, iterate back through steps 4–5.
- If the library referenced is an API set, remember to use Get-NtApiSet from the NtObjectManager module. This will help you find the host module that the function is exported from, and helps de-obfuscate the confusion of API sets that point back to the DLL you just came from. Remember to enumerate “Hosts” to validate which host module is the final resting place of the particular function.
- Once you reach NTDLL, start looking for the base syscall. This is the final call being made in the function call stack, and the last point in determining the underlying operation that is taking place in user mode. Note that you may find functions referencing multiple functions at the NTDLL level (or higher levels, for that matter). This will require additional analysis, but the steps laid out here are sufficient to keep digging.
- Once you’ve identified the full function call stack, move on to the next function and be sure to string these together in a meaningful way. Sometimes functions are written in succession; sometimes there are a lot of IF-ELSE type statements that might throw your analysis for a loop.
- Share your experience — if you learned something new, I encourage you to write your own experience and share what you’ve learned.
Conclusion
Going through this process was a bit daunting for me at first, but something I was eager to get better at because I wanted to dig beyond the level of “Procedure” that we tend to stop at for one reason or another. For me, that mental model of “Tactics, Technique, and Procedures” ended with the “Procedure” level and I failed to consider what might be below that. My mistake.
But going through this process, I realized that it’s less daunting than it might originally seem. In some aspects, it can be very straightforward and simple to start understanding what’s going on under the hood. I also learned a little bit more about what’s going on under the hood of a particular tool, and having now looked at several tools, I’ve started to see similarities between what they’re doing. Between opening or creating handles, accessing tokens, querying tokens, and closing handles, these operations demonstrate a commonality across tools that isn’t immediately evident without digging deeper.
Of course, it should be noted that my own walkthrough is fairly basic — and that’s the intent. I mean to help others get started, and so this blog may not be sufficient for deeper levels of technical analysis that you may require for digging into more complex tools. This is true especially if you don’t have the code base to look at, but that’s another matter entirely. This is also true for tools that leverage Remote Procedure Calls (RPC) — there is a similar methodology with some slight variation I do not cover here.
For those who may have any additional questions, feel free to reach out here, LinkedIn, or Twitter. I look forward to helping others as they go through their own learning process. From here, I’d also recommend pivoting to Jared Atkinson’s blog series, “On Detection: Tactical to Functional,” as he goes on to address things such as how different tools start to leverage similar functions; how to deal with RPC vs standard Win32 APIs; compound functions, which include multiple functions nested within one; and functional variations that result in thousands of variations for how an attacker can execute a particular procedure. For additional reading, or for those references I mentioned, please see the resources below. Otherwise, best of luck to everyone as you keep looking under the hood to better understand the technologies we work with.
Special Thanks
Much appreciation goes to Jonny Johnson for answering a barrage of questions through my own learning experience, Jared Atkinson for breaking this down and making it click that first time around, and to Evan McBroom for going all the way to the patent level to provide an answer to one of my many “but why” questions.
Resources
Requirements:
- Windows 10 (results may be different based on other version of Windows)
- IDA — Free Download: https://hex-rays.com/ida-free/
- NtObjectManager: https://www.powershellgallery.com/packages/NtObjectManager/1.1.33
PowerSploit:
- Main Page: https://github.com/PowerShellMafia/PowerSploit
- Get-ProcessTokenPrivilege (within PowerUp): https://github.com/PowerShellMafia/PowerSploit/blob/d943001a7defb5e0d1657085a77a0e78609be58f/Privesc/PowerUp.ps1#L1236
IDA
Arrows Graphing Site
Documentation:
- Processes & Threads: https://learn.microsoft.com/en-us/windows/win32/procthread/processes-and-threads
- Win32 APIs: https://learn.microsoft.com/en-us/windows/win32/apiindex/api-index-portal
- API sets: https://learn.microsoft.com/en-us/windows/win32/apiindex/windows-apisets
- Dynamic Link Libraries — https://learn.microsoft.com/en-us/windows/win32/dlls/dynamic-link-libraries
MITRE ATT&CK
- T1057 — Process Discovery (Get-ProcessTokenPrivilege): https://attack.mitre.org/techniques/T1057/
- Powersploit Entry: https://attack.mitre.org/software/S0194/
Further reading on the Function Call Stack:
- Function Call Stack: https://medium.com/specter-ops-posts/understanding-the-function-call-stack-f08b5341efa4
- On Detection: Tactical to Functional (#1): https://medium.com/specter-ops-posts/on-detection-tactical-to-functional-d71da6505720
Patent Document
Beyond Procedures: Digging into the Function Call Stack was originally published in Posts By SpecterOps Team Members on Medium, where people are continuing the conversation by highlighting and responding to this story.