Defenders Think in Graphs Too! Part 2
Introduction
Welcome back to our “Defenders Think in Graphs Too!” series! In the previous post in this series, I reintroduced Get-InjectedThread, a script I released with Joe Desimone in April 2017. In this post, I want to discuss the concept and importance of Data Quality and how you can apply Data Quality principles to your data set. We will then walk through a Data Quality assessment of Get-InjectedThread’s output data, and release a proof-of-concept script that implements many of the ideas discussed.
Analyzing Get-InjectedThread
At first, Get-InjectedThread appeared to be an advanced function, using low-level Windows functions to detect many forms of Code Injection. However, we quickly realized that by mashing disparate data types (thread, process, token, logon session) together we are limiting the usefulness of the data.
Let’s take a look at the output of the Get-InjectedThread function:
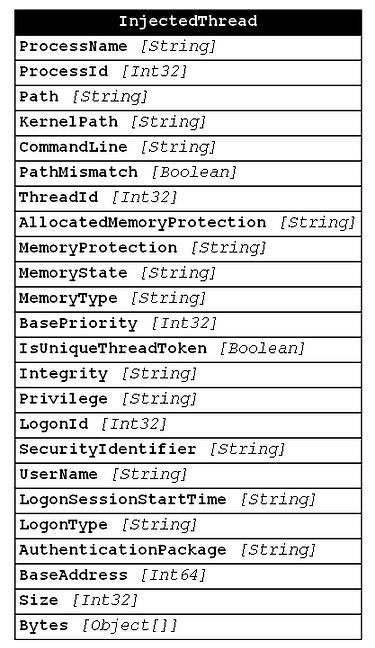
There are two overarching issues that stop Get-InjectedThread from maximizing its utility:
- Analysis is done on the endpoint, which limits output.
- The output object combines multiple different data types, which hurts flexibility during analysis.
I’d like to touch on these two points in a bit more detail before we continue with the data quality piece.
Limited Output
Get-InjectedThread simplifies analysis by only providing output if a “hit” is found. This seems like a great idea at first, but in reality you are doing a lot of processing on the endpoint and leaving the majority of your data to rot in the abyss because the script only outputs data if “injection” is found. Generally speaking, we want to push as much data to our SIEM as possible if we’ve already collected it, because we may be able to derive value from data that wouldn’t appear valuable to us directly. For instance, the output of Get-InjectedThread provides Access Token information for each hit, but for a bit more processing we could have all Access Token instances, which might help us detect Access Token Manipulation attacks.
Combined Data Types
The output from Get-InjectedThread is a conglomeration of multiple data types. It joins a few data fields from each data source to return one single object. This is due to the apparent limitations of our SIEM solution and a bit of ignorance on our part. Elastic is a non-relational database, so it is difficult to perform sub searches that join fields across separate documents. Due to this fact, I made the decision to perform the correlation within my collection function. By doing this, we limited the utility of the data set to the explicit Get-InjectedThread use case. Ultimately, if data is kept atomic (broken up to its smallest set) then that data is more flexible in its use. This allows us to collect once and apply many “detections” or analytics to the same data set, which again maximizes our use of resources.
If we break out the different data sets involved in Get-InjectedThread, we end up with the information below:

By breaking our data into its individual parts, we start to get an idea of the types of data that we are dealing with to make a single detection decision. We notice that no individual data type seems to stands on its own, but we also notice that we have introduced new problems into our data… specifically, how can we assemble these pieces to form the data frame required to conduct our analysis? This blog post strives to answer that question by discussing Data Quality and performing a Data Quality assessment on this new broken down data set. By the end of this post, we should have a data set that is ready for analysis!
Data Quality… What is it?
A few months ago, Roberto Rodriguez released a post titled “Ready to hunt? First, Show me your data!”. In this post, Roberto discussed the importance of ensuring that the data you use for your Threat Hunting adventures is of high quality. At the time, I had not heard of the “Data Quality” field, but had an inherent understanding that there was something different between different data inputs. Can you trust this data? Is this data being collected in real time or on some sort of interval? Can this data be used to answer multiple different questions? Can I relate the data from source x to the data from source y? These are the type of questions I was asking, but I think Stephanie Zatyko from Experian put it most simply when she defined it by saying, “if data was water, data quality ensures water is clean and does not get contaminated.” So how do we make sure that our data remains “potable”? Well, we need to run it through a thorough Data Quality Assessment using a common set of criteria, known as Data Quality Dimensions. There are many definitions for different dimensions, but we have defaulted to the six defined in a document written by the United States Department of Defense in a document called DoD Guidelines on Data Quality Management. Below is a list of the six dimensions specifically defined in the aforementioned document:
- Accuracy
- Completeness
- Consistency
- Timeliness
- Uniqueness
- Validity
The remainder of this post will be a deep dive into each dimension of the Get-InjectedThread use case.
Data Quality Analysis
Data Quality analysis is an important step for maximizing the utility of your data inputs. In this section, we will perform an analysis of Get-InjectedThread by discussing each Data Quality Dimension as they relate to our data set. It is worth identifying that some dimensions are more applicable to this data set and our use case than others, so the level of detail in the analysis of each dimension will depend on those factors. Also, we are analyzing this data under the assumption that all data types will be broken out on their own as discussed above. The result of this analysis is a new script called Get-SOHostData, which we think this script solves many of the inherent issues we found with Get-InjectedThread.
tldr;
The analysis portion of this post is rather lengthy, so we wanted to list some of the highlights and major improvements made to Get-InjectedThread up front. Some of the major improvements include:
- Breaking each event into its atomic part (memory region, thread, process, access token, logon session, and Kerberos ticket granting tickets)
- Including more properties to our output data. We originally limited output to those properties that were explicitly useful for detecting code injection, but we want our data to help answer multiple questions.
- Move analysis to backend systems by outputting all events for each data type.
- Add unique identifiers to each data type.
- Identify relationships between data types and added pointers from one related instance to another to support correlation.
With these updates, we think we are able to provide a more rounded solution that will maximize the value of the limited resources we have available. If you are interested in a much more in depth understanding of how this analysis unfolded, please continue reading the remainder of the article.
Accuracy
Accuracy is the degree to which data correctly describes the “real world” object or event being described. Is the data you are receiving accurate? How do you know this? We believe the first step in determining the accuracy of data is to understand where that data is coming from. Below is a description of how the Get-SOHostData results are being collected. More specifically, this portion discusses the .NET Classes and methods and/or API calls used to gather the data.
Memory Region
The Memory Region data is gathered by calling the VirtualQueryEx API function on a specific process’ memory address. The memory address is currently identified via the Thread object’s ThreadStartAddress property, which represents the starting location of any code being run by the thread. The resulting data is a representation of the MEMORY_BASIC_INFORMATION structure returned from the VirtualQueryEx call.
Process/Thread
Thanks to PowerShell’s Get-Process cmdlet, gathering Process and Thread entries is quite simple. Get-Process is a PowerShell cmdlet that implements the .NET System.Diagnostics.Process class’ GetProcesses() method. Ultimately this method returns an array of all currently running processes. As a bonus, the Threads property of the System.Diagnostics.Process class contains an array of System.Diagnostics.ProcessThread class instances. This cmdlet makes Processes and Threads significantly more straightforward to collect because the collection logic is already built directly into PowerShell.
Of course we can take our analysis of the accuracy a step further. PowerShell is a scripting language built on .NET, and .NET is a managed programming language which implements Windows APIs via a mechanism called P/Invoke. P/Invoke is a mechanism for calling functions implemented in an unmanaged (native) DLL. Luckily for us .NET is open source, so we can inspect the source code to identify exactly what APIs are being used to collect this information. After a bit of digging through the source code, we found that the GetProcesses() method uses the NtQuerySystemInformation with the SystemProcessInformation SystemInformationClass parameter. This query returns a pointer to a buffer which contains a SYSTEM_PROCESS_INFORMATION structure for each process that was currently running at the time of the function call. Additionally, according to the NtQuerySystemInformation documentation each SYSTEM_PROCESS_INFORMATION structure is followed by one or more SYSTEM_THREAD_INFORMATION structures representing the threads belonging to the preceding process at the time of the function call.
Access Token
Every process and some threads (those implementing impersonation) have associated Access Tokens. Access Tokens are kernel objects that cannot be accessed directly from a normal user context. Instead, this information must be queried via the GetTokenInformation API function. To request information via GetTokenInformation, we must first request a handle to a particular process or thread with the OpenProcess and OpenThread functions respectively. Once a process or thread handle is obtained, a token handle must be requested with a call to OpenProcessToken or OpenThreadToken. It is worth noting that non-impersonating threads will throw an error when OpenThreadToken is called for them. In this case, assume that the thread is inheriting the access token from its owning process. With a token handle, GetTokenInformation can be used to query information about the target Access Token in the kernel. To understand more about what type of data can be queried using GetTokenInformation, check out the TOKEN_INFORMATION_CLASS enumeration.
Logon Session
Logon Sessions are gathered independently of other data points. This can be accomplished by first calling LsaEnumerateLogonSessions which returns a pointer to a list of Logon Sessions data structures and a count of how many logon data structures there are. For each Logon Session in the list, GetLogonSessionData should be called to query that specific session. GetLogonSessionData returns a SECURITY_LOGON_SESSION_DATA data structure which contains the information about the session itself.
Caveats
To some degree we must trust that the API code is implemented correctly, but it may be possible that our implementation is flawed. Many of the data sets we are viewing reside in the kernel, so it may be hard for us to investigate them further. Luckily, we can use windbg’s kernel debugger to investigate just a bit further. This being said, kernel debugging is probably a bit out of the scope of this article, so I will leave the experimentation with windbg as an exercise for an interested reader, or possibly as a future post.
Additionally, it is worth mentioning that this method of collection occurs on a live system and relies on Operating System APIs. There is always a possibility for an attacker to manipulate the system in such a way that causes the APIs to return bogus information (through a rootkit or API hooking of some sort). This is an assumed risk and this type of activity should be accounted for via some other mechanism such as Memory Forensics.
Completeness
Completeness is defined as “the proportion of stored data against the potential of ‘100% complete’”. In other words, do we have values for all the data on the system we are scanning? The original Get-InjectedThread function had a couple issues when it came to completeness. These issues stemmed from Get-InjectedThread’s intended use case, which was simply to detect any injected threads. However, in a real Threat Hunting engagement, it is important to maximize the value of your data collection efforts. I realized that I was running the Get-InjectedThread code on target systems, but was discarding the majority of the data that I was collecting. We decided to collect as much data as possible and save the analysis for back end systems (SIEMs) that are tailored to that task. Additionally, the fields that made up the Get-InjectedThread object were limited to those used for analyzing Code Injection, which limits our ability to apply this data set to multiple analysis use cases.
To ensure the completeness of our Get-SOHostData data set, we made two major changes. First, we decided to output all Memory Region, Thread, Process, Access Token, and Logon Session instances. This approach provides us with the data necessary to answer multiple questions after executing one collection script. Second, we reviewed available data points or properties that had not previously been included in our output to decide what additional information would be beneficial to our analysis efforts. The remainder of this section describes our review of each data point and compares our original data set to our new data set.
WinEvent-MemoryRegion
The WinEvent-MemoryRegion event schema is based on the MEMORY_BASIC_INFORMATION structure returned from the VirtualQueryEx function as described above. We can compare the original Memory Region information that was included in Get-InjectedThread with the information available to us via the MEMORY_BASIC_INFORMATION structure to identify any properties that could be worth including. Below is a screenshot of the MEMORY_BASIC_INFORMATION structure definition:
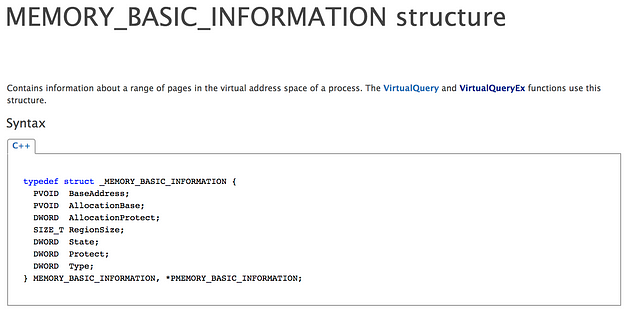
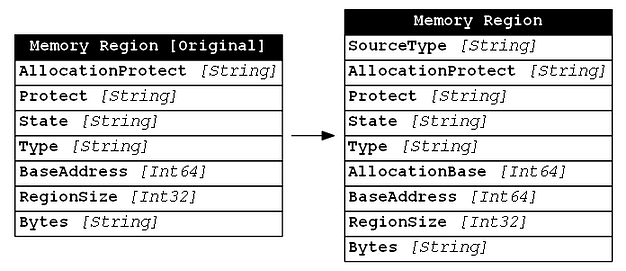
After reviewing this structure definitions we found that we did not include the AllocationBase property which contains a pointer to the base address of memory pages allocated by the VirtualAlloc call. This may provide useful context for us to analyze, so we added it to the new WinEvent-MemoryRegion schema as shown below:
WinEvent-Thread
The WinEvent-Thread SourceType represents instances of currently running (at the time of collection) threads on the system. Based on our analysis of the Get-Process cmdlet, we determined that the Thread property is populated by calling NtQuerySystemInformation which ultimately leads to instances of the SYSTEM_THREAD_INFORMATION structure which is shown below:
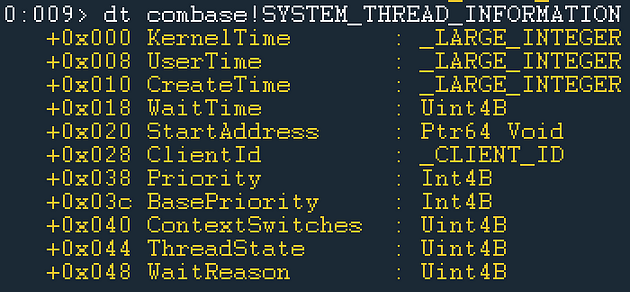
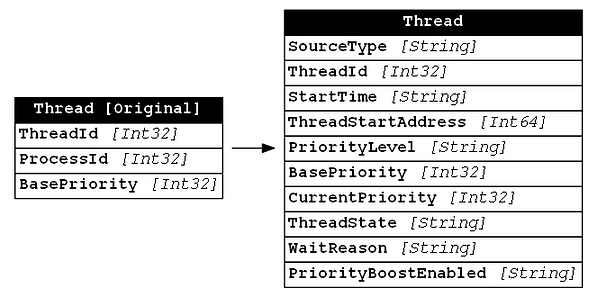
In the case of Get-InjectedThread, the thread is the glue that combines the injected process to the actual injected code, so not much information was needed. However, in an effort to provide as much context as is reasonable, we found it valuable to output as much information as was reasonable, so we included almost every data point in the SYSTEM_THREAD_INFORMATION structure. We decided, at this point, to exclude the KernelTime, UserTime, and WaitTime since those values are very volatile (they change frequently) and we haven’t found a good use case for them in our analysis. Below you will find a comparison between the thread information collected by Get-InjectedThread and the information collected after this analysis:
WinEvent-Process
Like WinEvent-Thread, WinEvent-Process instances represent currently running processes on the system. These events are derived from a call to NtQuerySystemInformation which results in a SYSTEM_PROCESS_INFORMATION structure instance for each process. The structure is shown below:
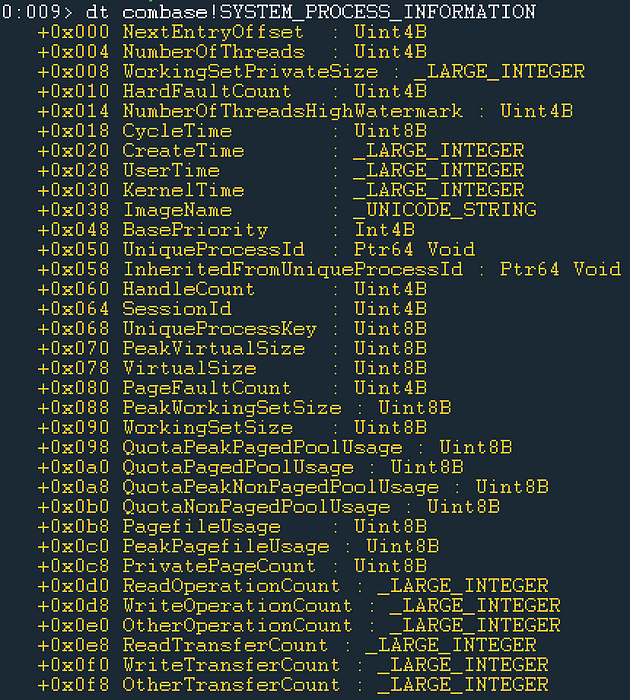
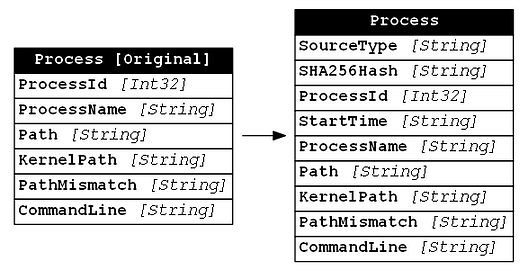
Similar to our thoughts with WinEvent-Thread, the SYSTEM_PROCESS_INFORMATION has many properties which represent very volatile information, which would not provide reliable context. For this reason, we leave many of these properties out. One important bit of information that we added that is not contained in the SYSTEM_PROCESS_INFORMATION structure is the SHA256 Hash of the process’s binary. We tend to use the hash value to derive uniqueness more than to identify known bad. Below is a comparison of the process information collected by Get-InjectedThread versus that collected by Get-SOHostData.
WinEvent-AccessToken
The user context of each process and thread is represented by an access token. Get-SOHostData represents access tokens as WinEvent-AccessToken events. In the Accuracy section we discussed using GetTokenInformation to query the _TOKEN structure in the kernel. For reference, the _TOKEN structure is shown below:
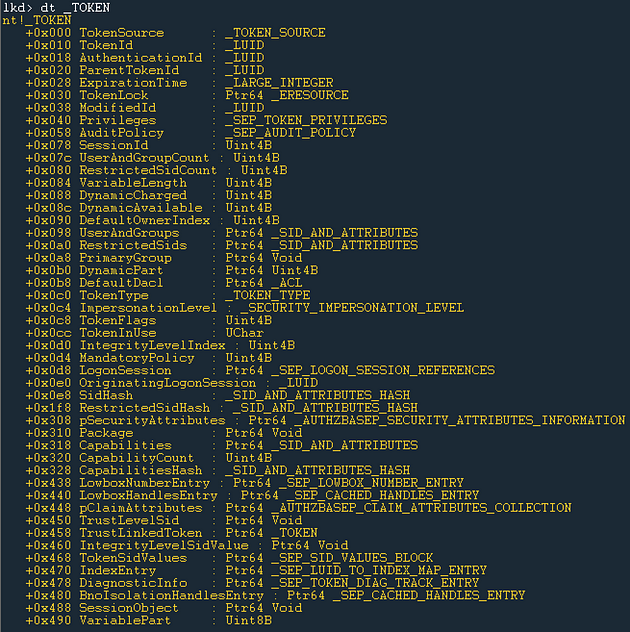
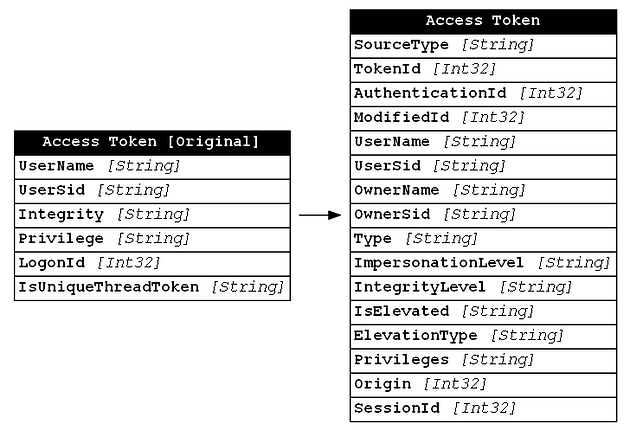
GetTokenInformation acts as a proxy from your application, in our case a PowerShell script, and the _TOKEN structure itself. We decided that Get-InjectedThread did not collect sufficient context for access tokens, so we added additional properties like TokenId, AuthenticationId, ModifiedId, OwnerName, OwnerSid, Type, ImpersonationLevel, IsElevated, ElevationType, Origin, and SessionId. With this information we can analyze the tokens themselves, instead of simply using access tokens as a contextual reference. Below you can see a comparison of the original Get-InjectedThread access token structure and the new Get-SOHostData structure:
WinEvent-LogonSession
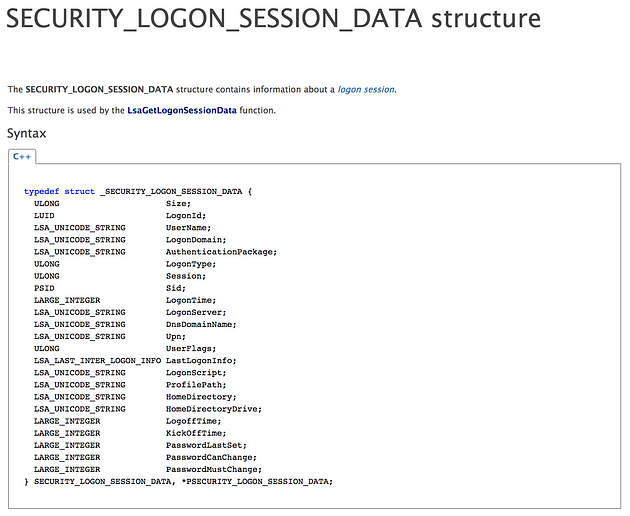
All Logon Session events fall into the WinEvent-LogonSession sourcetype. As was discussed earlier, this data is collected via a call to LsaGetLogonSessionData which returns a SECURITY_LOGON_SESSION_DATA structure which is shown below:
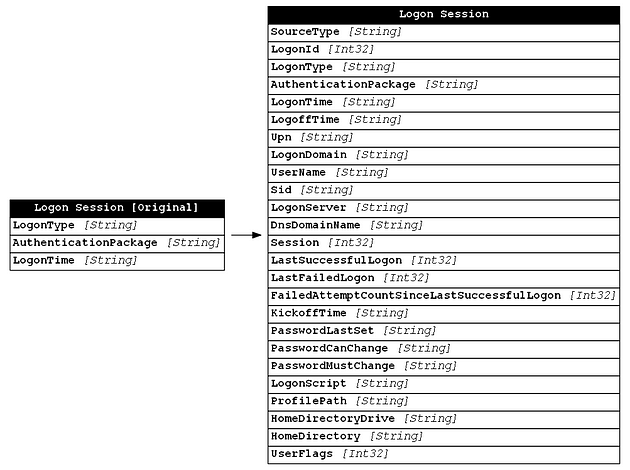
Get-InjectedThread included very little information about the associate Logon Session, since only the LogonType, AuthenticationPackage, and LogonTime properties were deemed necessary for analysis. Get-SOHostData now includes every property contained within the data structure, for better analysis opportunities. Below is a comparison of the original Logon Session data contained in Get-InjectedThread and the improved data structure returned from Get-SOHostData:
Now that we have an idea of what each atomic data type will look like, we can begin to focus on how it all comes together.
Consistency
Consistency is the absence of difference, when comparing two or more representations of a thing against a definition. It is difficult to measure consistency with just our data source, since by definition it is measured against other data sources. For example, you can have consistency of naming for Get-InjectedThread’s fields, but it is better to do at the ingestion pipe level (something like Logstash) to follow the same desired naming across all monitoring tools (sysmon, EDR, etc). You want to ensure that each field’s name is unambiguous, so you don’t end up with fields called “pid”, “processId”, “process_id”, for example.
Consistency is an important dimension of data quality, but we think it has limited value at the individual signal level. In a later post in this series, Roberto will discuss consistency across the entire environment from the SIEM perspective, using tools like Logstash to ensure consistent naming conventions from all data sources.
Timeliness
Timeliness is the degree to which data represents reality from the required point in time.
To me, this really begs the asking of two questions. First, what type of collection am I employing? Is this collection based on an endpoint agent, collecting data in real time, or is it based on a sweep methodology, where data is collected on an interval? Second, does the collected data contain a timestamp that is able to indicate when the event actually occurred. The first question also relates to the completeness of the data set, while the second question is focused on providing accurate context based on the time of the event.
I previously documented my understanding of different data collection techniques in a blog post called Thoughts on Host-based Detection Techniques. There I defined three collection techniques; Point-in-time, Real-time, and Historic. Get-SOHostData is what I describe as a “Point-in-time” collection capability. What this means is that Get-SOHostData collects a snapshot of information at the exact moment(s) that the script is run, but not in between. This means that any event that occurs after the last scan and before the next scan will not be included in our data set. For instance, if Get-SOHostData is being run every five minutes and a process is started and stopped between the 5 minute scan interval, then Get-SOHostData will not see/collect information about the process. The value of Point-in-time collection is that it is often more flexible than other collection methods and thus can collect data types that are otherwise not available.
Since the collection provides just a snapshot of activity, we want that snapshot to be as full features as possible. Think of it like screen resolution, why watch a sports match in 480p when you can have 4K? If you stick with 480p, you are likely to miss small details that provide important context to what is going on. Similarly, if you limit your collection to just one data type (threads for example), you may miss important associations like what process that thread belongs to, even if you run a process collection scan immediately afterward. Remember, a process is an ephemeral artifact and may not exist at the time of the second collection, thus it is important for Point-in-time collection to be as full featured and comprehensive as possible.
In a perfect scenario, Point-in-time collection is used to supplement an already existing Real-time data source. In this case, the Point-in-time data should be designed such that it can be correlated with the Real-time data to provide a comprehensive solution.
A second important factor for timeliness, especially in the context of Point-in-time collection, is the presence of timestamps and the story they tell. Tools like Logstash mark events with an ingestion timestamp, but ingestion time is largely irrelevant when dealing with Point-in-time collection. An ingestion timestamp might tell you that a process was running at that particular time, but it wouldn’t give you the full context of when the process was started for example. For this reason, it is important to identify/include contextual timestamps in our data as much as possible. For example, both process and thread events have a StartTime property which represents the time the process or thread was started. If you detect a thread that has evidence of injection, you can use the thread event’s StartTime property to identify when the injection took place. You can then use that timestamp as a starting point to pivot into other data sources during an investigation.
Uniqueness
Uniqueness is defined as the trait that nothing will be recorded more than once based upon how that thing is identified. One of the main issues with separating our data into atomic types is that the data is no longer related. For example, the SYSTEM_THREAD_INFORMATION structure does not have an inherent pointer to its related process or memory region instances. To make correlation possible, we must add a series of keys (or IDs) to each data type and explicitly add these associations to each data type.
One common misstep is to assume that fields like ProcessId are unique enough to differentiate between instances, but the reality is that ProcessIds tend to be reused somewhat frequently. Over time and across numerous endpoints, it is unlikely that ProcessId will provide sufficient uniqueness to differentiate process instances. Because of this, we must create our own “algorithm” for creating a unique key. This algorithm should be unique for each data type. Additionally, the algorithm should be derived of unique static values. In our process example, we found that a combination of ComputerName, ProcessId, StartTime, and Path was enough to uniquely identify a process from every other possibility. We also found that fields like VirtualMemorySize or UserProcessorTime are too variable to provide a consistent but unique identifier. With the new algorithm, we can create the Process Key by calculating a SHA256 Hash for the a string containing those fields. The Get-ProcessKey function is an implementation of this mechanism used within the new version of Get-InjectedThread.
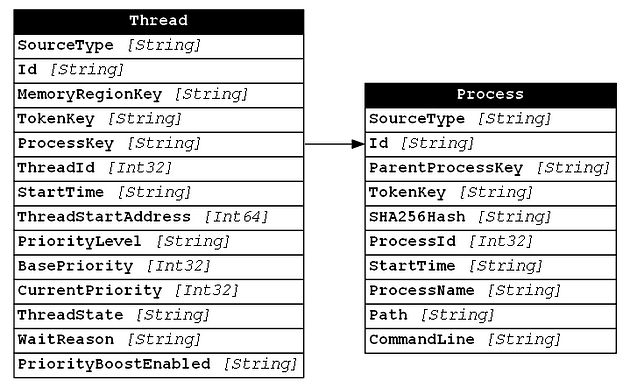
Once we have a unique identifier for a data type and that identifier is added to both the data type itself (as an Id field) and any related data types (as a named Key field) we can begin to represent that relationship between data types. For example, in the image below we show the relationship between a Thread and a Process where the Thread’s “ProcessKey” field points to the Process’s Id field.
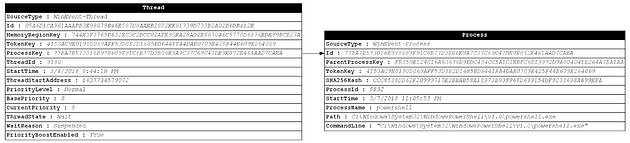
To see what this looks like in practice, let’s take a look at the Thread and Process with the field values filled in (notice that the ProcessKey and Id fields contain the same value):
The process of creating a unique identifier should be repeated for each data type. We can then create a unique identifier for each atomic data type we deal with. The formulas we have chosen are shown below:
Memory Region
- Computer Name
- Process Key
- BaseAddress
- RegionSize
Thread
- Computer Name
- Thread Id
- Thread Start Time
Process
- Computer Name
- Process Name
- Process Id
- Process Start Time
- Process Path
Access Token
- Computer Name
- Token Authentication Identifier
- Token Modified Identifier
- Token Id
Logon Session
- Computer Name
- Logon Id
- Security Id (Sid)
- Logon Type
- Authentication Package
- Logon Time
This is a simple logical correlation that can become much more complex as our data set grow. In the previous post, I mentioned that Elastic is not known for its ability to correlate different data types, so you may be thinking “what good does this do for us?”. That is a great question and will be the focus of Part 3 and 4 of this series. For now, let’s assume there is an answer to that question and continue focusing on our data quality assessment.
By creating a unique identifier for each data type, we are able to also identify relationships between the data types. Below is a list of the relationships between the data types we defined in Get-SOHostData:
- MemoryRegion:ProcessKey → Process:Id
- Thread:MemoryRegionKey → MemoryRegion:Id
- Thread:TokenKey → AccessToken:Id
- Thread:ProcessKey → Process:Id
- Process:ParentProcessKey → Process:Id
- Process:TokenKey → AccessToken:Id
- AccessToken:PrimaryTokenKey → AccessToken:Id
- AccessToken:LogonSessionKey → LogonSession:Id
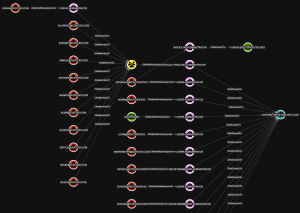
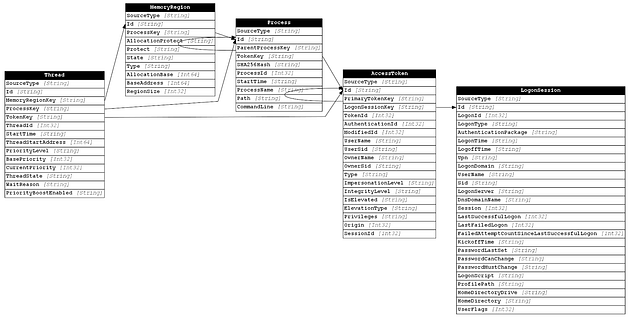
Now that we have created unique identifiers for each data type (nodes) and established a list of relationships (edges), we can begin to view our data as a graph (of course we are still focused on the conceptual aspect at this point). Below is a graph showing the data types and their relationships to one another as described above:
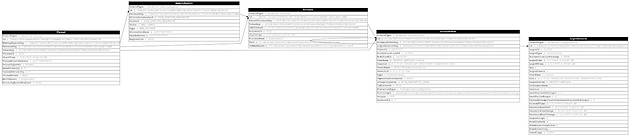
If you want to get a better picture of how the relationships look with the full data, check out the next image:
Validity
Validity is the idea that data are valid if it conforms to the syntax (format, type, range) of its definition. This dimension is often related to data that is defined with a strong schema. For example, if you have a field that expects a string, but instead receives an integer then there is a Validity issue. However, in our use case, anomalies like this prove interesting from an analysis perspective and should be considered event context. For this reason, we decided not to perform a detailed analysis of the validity of our data set.
Conclusion
Hopefully this post inspires you to think about your data more critically. I am by no means an expert on Data Quality, in fact, I’m just getting started, but I have realized that a method to the madness is required to scale collection and detection properly. Some of the key takeaways that I hope you received (if you persevered this long) are:
- To maximize the utility of data, it should be broken down into its component parts
- Try to include as many data properties as are reasonable, as they may be more valuable than you think
- It is ideal to do analysis on the backend where possible; collect once and analyze often
- Identify relationships between data types and build in ways to correlate based on those relationships
- Consider gaps in your collection mechanism and identify supplementary collection that can fill those gaps
Did I miss anything? If so, please let me know in the comments below as I am still learning as well! This concludes our data quality assessment of the artist formerly known as Get-InjectedThread. Stay tuned for the next posts in our series “Defenders Think in Graphs Too!”