Attack Infrastructure Log Aggregation and Monitoring
This post was co-written by Steve Borosh (@424f424f) and Jeff Dimmock (@bluscreenofjeff).
Monitoring attack infrastructure can prove to be as important as our attacking. Quickly hiding from investigating blue teamers can mean the difference between keeping our interactive command and control (C2) sessions and burning our infrastructure. If you’ve read the Red Team Infrastructure Wiki that Steve and I wrote, you know we’re big fans of heavily distributed infrastructure and using redirectors in front of everything. Monitoring becomes increasingly difficult when we have 20+ assets comprising our infrastructure. Luckily for us, this problem was solved a long time ago with rsyslog. In this post, we’ll cover how to monitor a distributed attack infrastructure with rsyslog to help facilitate quicker counter-response actions.
Design
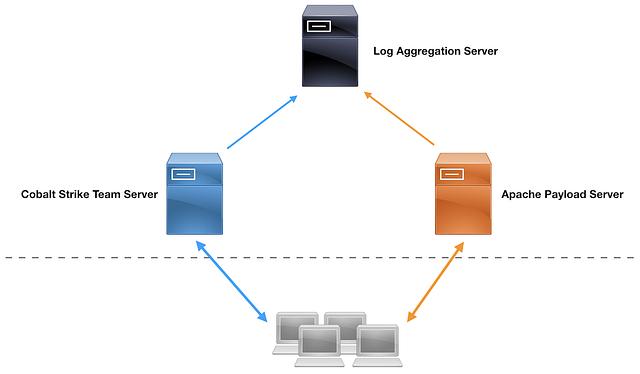
Rsyslog follows a server/client architecture. We will configure a dedicated host as the rsyslog server to receive log entries and parse the logs for meaningful events. Our team servers and webservers will act as the clients and forward their logs to the server.
Rsyslog can be configured to forward logs from many different programs. Essentially, if a tool is capable of outputting a regularly-formatted log, the data can be logged to a central server via rsyslog. In this post, we’ll be focusing on Apache logs to illustrate the concept.
Here’s a diagram of the lab setup:
By default, rsyslog is a plaintext protocol; however, it does support SSL/TLS encryption. Configuring this monitoring setup with TLS requires additional steps, including generating a machine cert for each host that will be forwarding logs. The added complexity may or may not be necessary for your setup.
Here are a few factors to think about: How sensitive is the data being transferred? Is it just web traffic? Any target metadata that shouldn’t be leaked? How ephemeral will the assets be? Each time infrastructure is rolled, reconfiguring TLS may be a significant effort. Can you script the deployment? Do you anticipate any “hacking back” or blue teamers that may attempt to send false log entries if the logging server is discovered?
For more information about setting up rsyslog with TLS, check out the official documentation.
Log Aggregation with Syslog
A big shout out to Gary Rogers for these rsyslog setup instructions. The steps provided in this post are based on Gary’s steps, but modified to meet our needs. Each host requires setup; the logging server to receive the logs and the clients (i.e., our payload server and Cobalt Strike team server) to send the logs to the logging server. In a real setup, the logging server should be independent from any of the attack infrastructure and sufficiently hardened to prevent log tampering.
Logging Server Setup
Any *nix host with rsyslog installed should work for this setup, but for the demo we’re using a stock Debian 9 host.
By default, rsyslog sends messages over UDP. We will be using TCP in our setup to decrease the likelihood of entries being lost in transit. To enable TCP on port 514, add the following lines to /etc/rsyslog.conf:
$ModLoad imtcp
$InputTCPServerRun 514
Next, we need to set up local facilities to spool the access and error logs into. Add the following lines to the bottom of the same file:
local3.* /var/log/apache2/combined_error.log
local4.* /var/log/apache2/combined_access.log
Reboot the service to apply changes:
service rsyslog restart
Create the files /var/log/apache2/combined_access.log and /var/log/apache2/combined_error.log. Ensure rsyslog can write to the files.
Logging Clients Setup
Each client needs to be setup when the host is provisioned. The redirector and payload server’s setup steps vary slightly from the Cobalt Strike team server’s steps.
Payload Logging Client
Create /etc/rsyslog.d/apache.conf and insert the following text:
$ModLoad imfile

# Default Apache Error Log
$InputFileName /var/log/apache2/error.log
$InputFileTag apache-error-default:
$InputFileStateFile stat-apache-error
$InputFileSeverity info
$InputFileFacility local3
$InputRunFileMonitor

# Default Apache Access Log
$InputFileName /var/log/apache2/access.log
$InputFileTag apache-access-default:
$InputFileStateFile stat-apache-access
$InputFileSeverity info
$InputFileFacility local4
$InputRunFileMonitor

$InputFilePollInterval 1
If you are using a distro that isn’t Debian-based, lines 4 and 12 will differ. These lines should point to the Apache error and access logs, respectively.
Modify /etc/rsyslog.conf, adding the following text to the bottom of the file:
$WorkDirectory /var/lib/rsyslog # where to place spool files
$ActionQueueFileName fwdRule1 # unique name prefix for spool files
$ActionQueueMaxDiskSpace 1g   # 1gb space limit (use as much as possible)
$ActionQueueSaveOnShutdown on # save messages to disk on shutdown
$ActionQueueType LinkedList   # run asynchronously
$ActionResumeRetryCount -1    # infinite retries if host is down
local3.* @@192.168.10.11 #replace with rsyslog server
local4.* @@192.168.10.11 #replace with rsyslog server
Modify the IPs to match the IP of your rsyslog server on the last two lines.
Restart the service:
service rsyslog restart
Cobalt Strike Team Server Logging Client
To send Cobalt Strike team server weblog activity to our rsyslog server, we will need to use an Aggressor script to spool the weblog’s hits to a log file that roughly matches Apache’s default log format. Use agscript to launch this script on your teamserver:
./agscript <host> <port> syslog-monitor <password> /path/to/apache-style-weblog-output.cna
Create /etc/rsyslog.d/cobalt.conf and insert the following text:
$ModLoad imfile

# Default Cobalt Web Log
$InputFileName /var/log/cobaltstrike/weblog.log
$InputFileTag cobalt-strike-weblog-default:
$InputFileStateFile stat-apache-access
$InputFileSeverity info
$InputFileFacility local4
$InputRunFileMonitor

$InputFilePollInterval 1
Modify the log path on line 4 to match the weblog.log path on your team server.
Edit the file /etc/rsyslog.conf, adding the following text to the bottom of the file:
$WorkDirectory /var/lib/rsyslog # where to place spool files
$ActionQueueFileName fwdRule1 # unique name prefix for spool files
$ActionQueueMaxDiskSpace 1g   # 1gb space limit (use as much as possible)
$ActionQueueSaveOnShutdown on # save messages to disk on shutdown
$ActionQueueType LinkedList   # run asynchronously
$ActionResumeRetryCount -1    # infinite retries if host is down
local4.* @@192.168.10.11 #replace with rsyslog server
Modify the IPs to match the IP of your rsyslog server on the last line.
Restart the service:
service rsyslog restart
Demo
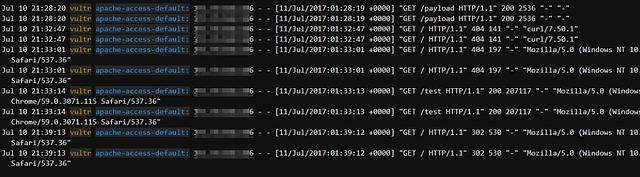
Here’s a demo of the configured combined access log:
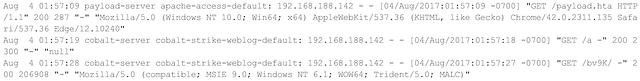
Notice that the default log entry format for the Apache logging is:
[Timestamp] [Client Hostname] [InputFileTag]: [Apache Request data]
Log Parsing & Monitoring
Now that we have data flowing into our rsyslog server, we need an easy way to pull meaningful event data from the logs. We could, and really should, review the raw logs while attacks are running, but there’s no reason we shouldn’t make sure important events are highlighted.
There are multiple methods, and indeed an entire industry, to implement effective alerting on log entries. For the purposes of this post, we’ll demonstrate setting up Apache to send our payload hosting logs to Papertrail so that we may keep an eye out for possible blue team probing.
Papertrail Setup
We’ll need a Papertrail account first. Thankfully, Papertrail offers a pretty decent free package! Once we’ve logged in, we’ll be able to add our first system. Setup is super easy. Papertrail also provides the command for us to start sending our rsyslogs directly to the cloud provider. We’ll need to follow the “Client Setup” section above in this post first to configure rsyslog to grab the Apache access.log.
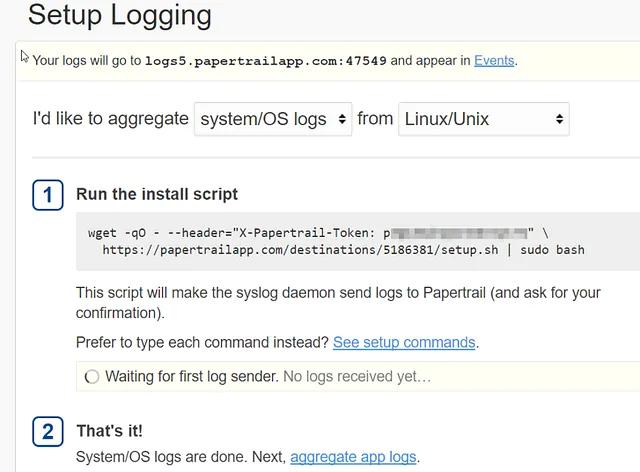
Once we’ve successfully run the provided install script, our logs should start syncing with Papertrail and we’ll be prompted with “Logs received from: our host”.
With the logs syncing, we can navigate to the “Events” tab in Papertrail. Here we’ll find all of the goodies that rsyslog is forwarding to our Papertrail instance. There is an easy-to-use search bar at the bottom of the screen where we can query against all or specific logging servers.
It’s important to note that Papertrail retains logs for two day(s) and will then archive them for us. Unfortunately, archived logs are not searchable in Papertrail. However, Papertrail makes up for this by allowing us to set up alerts based on your queries! Papertrail supports many platforms for alerting such as SMS, Slack, HipChat, and more. More details can be found here.
Let’s walk through an example alert for any hits against our payload.
First, start by performing a search in the search bar. Once our search is complete, select “Save Search”. We’ll be prompted with the window below.

Enter a catchy title for your search and select the “Save & Setup an Alert” button. You’ll be directed to a page to select the alert platform.

For this setup, we’ll use Slack, because Slack is awesome. Clicking on the “Slack” icon, we are prompted with a page to enter our Slack WebHook URI. Enter it, select your timing interval, and select “Save.” That’s it! We’re done. Once our alert fires, we’ll be prompted in our Slack channel, as shown below:

As we can see, we are being alerted every minute when our payload URI is hit by the blue team. Though, with rsyslog and Papertrail, we can do much more than payload hit detection. We can use our imagination to alert on things like port probes, SSH login attempts, email logs, etc. Anything we can rsyslog, we can import into Papertrail and alert on.
Summary
In this post, we covered how to setup log aggregation with rsyslog and how to create meaningful alerts to detect high-value actions on our attack infrastructure. Rsyslog provides an easy mechanism to forward logs onto a centralized server or third-party log aggregation service, like Papertrail. Actively monitoring our entire distributed red team attack infrastructure throughout an assessment enables us to respond faster to the blue team and change up tactics as they begin burning infrastructure elements.
Originally published at bluescreenofjeff.com on August 8, 2017.