To Infinity and Beyond!
Increasing our understanding of EDR capabilities in the face of impossible odds.

Introduction
I recently had a discussion with our chief strategist, Jared Atkinson, about purple teaming. We believe that large quantities of procedures per technique affect the overall success of the assessment. I began to theorize how I could prove this concept. In this post, I will discuss the validation of my theory.
You know what assumptions do…
When you take a technique and make a broad statement of detection you are often ignoring orders of magnitude more detail, forcing those who view it to make a broad assumption about what is and is not detected. Take this hypothetical EDR marketing:

While some portions of this example are purely satirical, this still seems great! We have four different techniques that are detected! But is this the full story? If you have been following Jared Atkinson’s posts, you may realize that each of these techniques look something like this:

This is a set of operation chains for different procedures of process injection. If you are unfamiliar with what operation chains are, I recommend reading Jared’s blog series on Tactical to Functional. Using this information, I asked myself, “How could I build a representation of my understanding of the EDR’s capabilities with respect to process injection?
EDR capabilities can, and should, be measured as a set of data. Our industry has different methods of measuring capabilities and representing the resulting data. Common examples that are used for measurement include Mitre ATT&CK Evaluations, or generically mapping the Mitre ATT&CK framework to testing performed via something like Atomic Red Team. The problem with evaluations of this type are that they typically focus on one variation of a technique, which can only represent one procedure. While usually not explicitly stated, those using those projects often mistake the results for full “coverage” of that technique. The reality is that none of these approaches are designed to be used or interpreted in this fashion.
The argument I am going to make throughout this post is that these tests are not particularly sufficient to guarantee coverage. In fact, no amount of testing will ever guarantee 100% coverage of any given technique. This does not mean all hope is lost of detecting the use of process injection, but it does mean that we need to better understand what our testing results actually mean — so at least we have knowledge of the potential gaps prior to accepting the risk.
EXCELerating Capability Testing
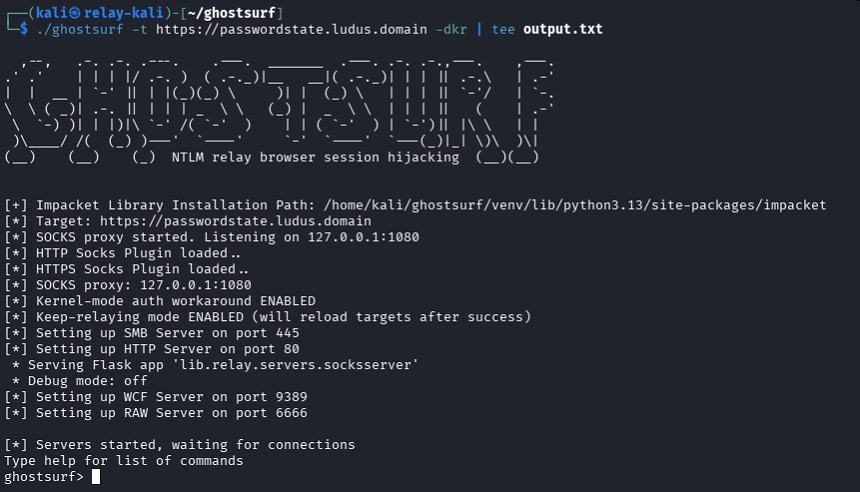
To start proving my argument, let’s start in Excel. We will build a table that represents a set of process injection procedures that an EDR may detect. The columns will represent the individual procedures while the rows will represent each possible combination of procedures an EDR may detect. We will treat a 0 as “not detected” and a 1 as “detected”. For this first example I will limit the procedures to “Standard” (e.g., shellcode injection) and “Thread Hijacking.” I am going to say, for the sake of argument, that these are the only two known forms of process injection. This means that there are four possibilities for an EDR’s capability to detect process injection. At this point, without running any tests, an end user of an EDR will have no idea which of the four outcomes is true for their EDR.
We can safely rule out some of these outcomes because we assume that an EDR is detecting at least one of these procedures to make the claim that it detects process injection. Let’s say that the most likely candidate for detection is standard shellcode injection since that is the canonical form that comes to mind when process injection is mentioned.
If we know that standard injection is detected with our theoretical EDR, then we now have two potential cases, albeit in our hypothetical world where there are only two known forms of process injection. We can show this on the chart by graying out the rows that are not relevant to our EDR.

The chart shows that by either testing or seeing real-world examples of an EDR detecting a given procedure we removed 50% of the possible combinations of process injection procedures the EDR can potentially detect.
I want to be clear here — this is not a probability that an EDR will detect a given technique, or a full coverage of the EDR capabilities. This is merely filling in 50% of our understanding of an EDR’s capability regarding a specific technique using known procedures for that technique. I am going to continue stressing this throughout this post. All of these statistics are applicable to better understanding an EDR but none of the table entries are weighted to convey the prevalence or any other attribute of a procedure.
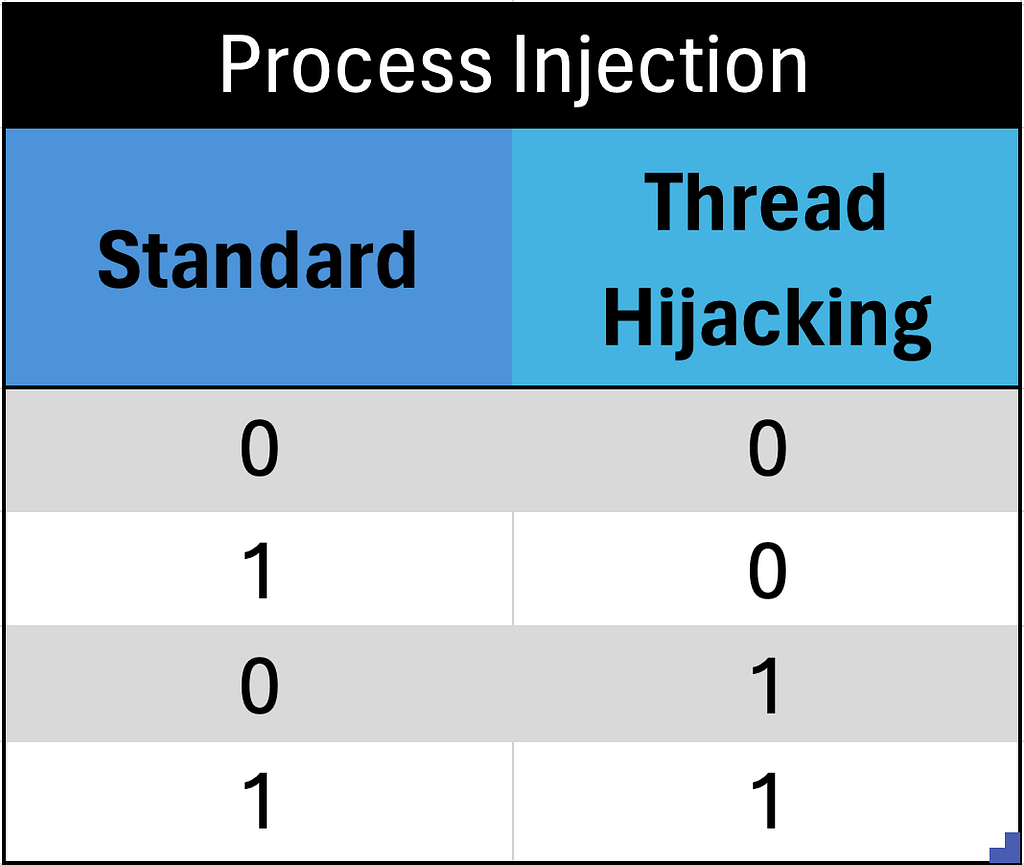
Let’s add a third procedure and see what happens to our potential capability.
We are dealing with exponential math here. There are two states that our data can be in, 0 or 1. So the number of potential combinations of procedures from the table that an EDR can detect is n^x , where “n” is the number of potential results and “x” is the number of procedures. So the table above can be represented as 2³or 8.
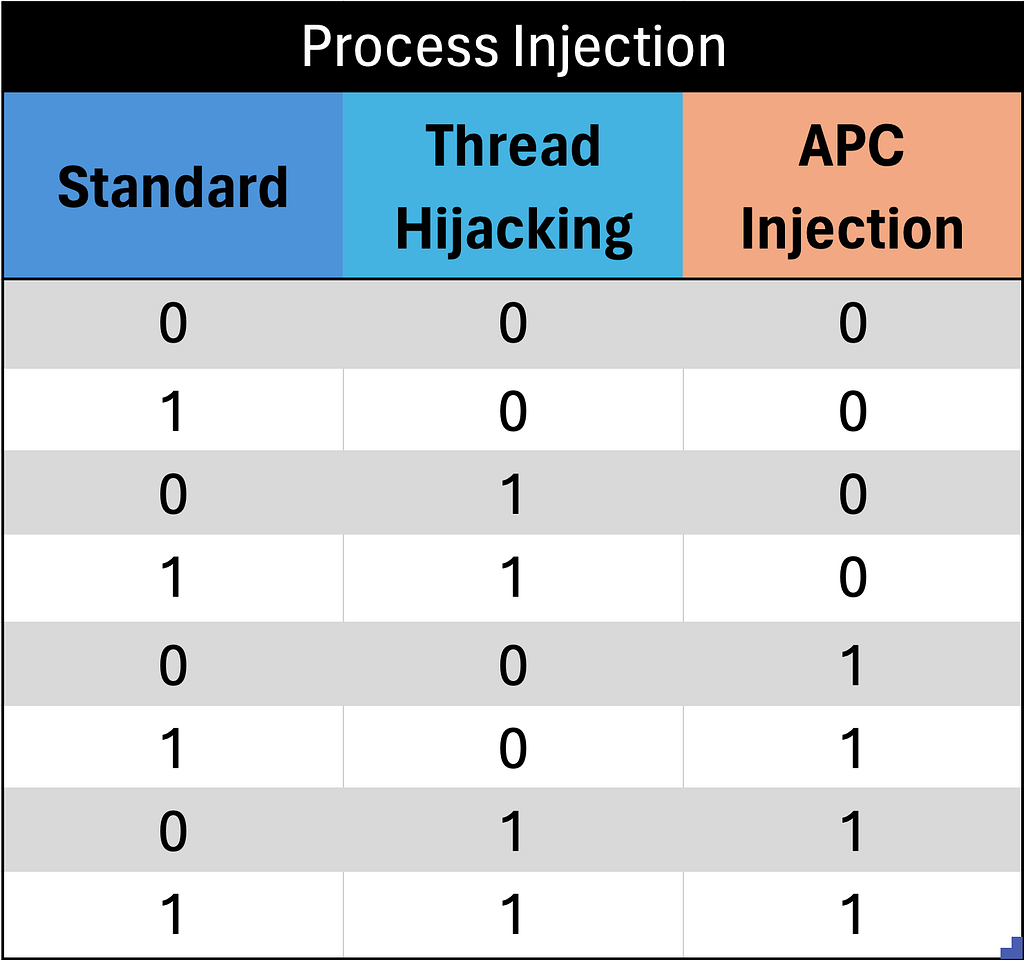
With 3 process injection procedures, we have expanded our hypothetical world to 8 possibilities, so what happens if I again run a test to see if my EDR detects standard shellcode injection?

We have once again eliminated 50% of the possibilities of what our EDR detects, with a single test case, even though we have doubled the amount of potential possibilities. What happens if you run a second test, and see if your EDR detects thread hijacking?
It does detect it! This allows us to throw away all of the potential states where thread hijacking is 0. Another 50% of the remaining possibilities have been removed. Are you starting to see the pattern? For each test case we ran we could remove 50% of the remaining possibilities from the table.
Let’s try one more test and bump this up to 6 total forms of process injection. Following our previous formula, our potential set of detection possibilities should be 2⁶ or 64.

Awesome! As before, I want to test my EDR and see if it is capable of detecting standard shellcode injection. We already know that it does from our previous testing but will it really remove 50% of our detection possibilities? Before immediately showing you the answer, look at the first column of binary data.

The options for Standard Shellcode Injection alternate between 0 and 1 every single time. So if we do detect it, then it will absolutely remove 50% of our results; just as it did before with a different number of process injection procedures. You may recognize these tables as truth tables and our testing process as being similar to a binary search algorithm, allowing each of our tests to reduce our possible detection combinations by half. This is demonstrated again in the following graphic by running each test in succession for the six chosen procedures shown before, and taking it to the logical conclusion.

This simply validates our previous testing with a larger dataset; There has been a singular theme throughout these tests. Each time we had limited our table of process injection procedures to a specific number of remaining rows. Given enough testing, it’s possible to arrive at a single combination of procedures an EDR will detect for a given technique, but what happens when we don’t know how many procedures there are?
To Infinity and Beyond!
Excel works well to illustrate finite numbers of procedures for performing a technique, but it fails to work as well when we don’t know what the true number of procedures are. The reality is that even though I listed six different forms of process injection for this post, there are certainly more than that in existence. In fact, as far as I know, there are an infinite number of ways to perform process injection!
The easiest way to visually represent this is with a curve.
Note: I am not good at math. The curve and the resulting formula is not an attempt to provide a real or usable method for plotting capability, it is simply an illustrative tool. Shoutout to Evan McBroom for helping me find a curve that fit what I was trying to show.
Take the following curve for example:
y=10/2^{x}
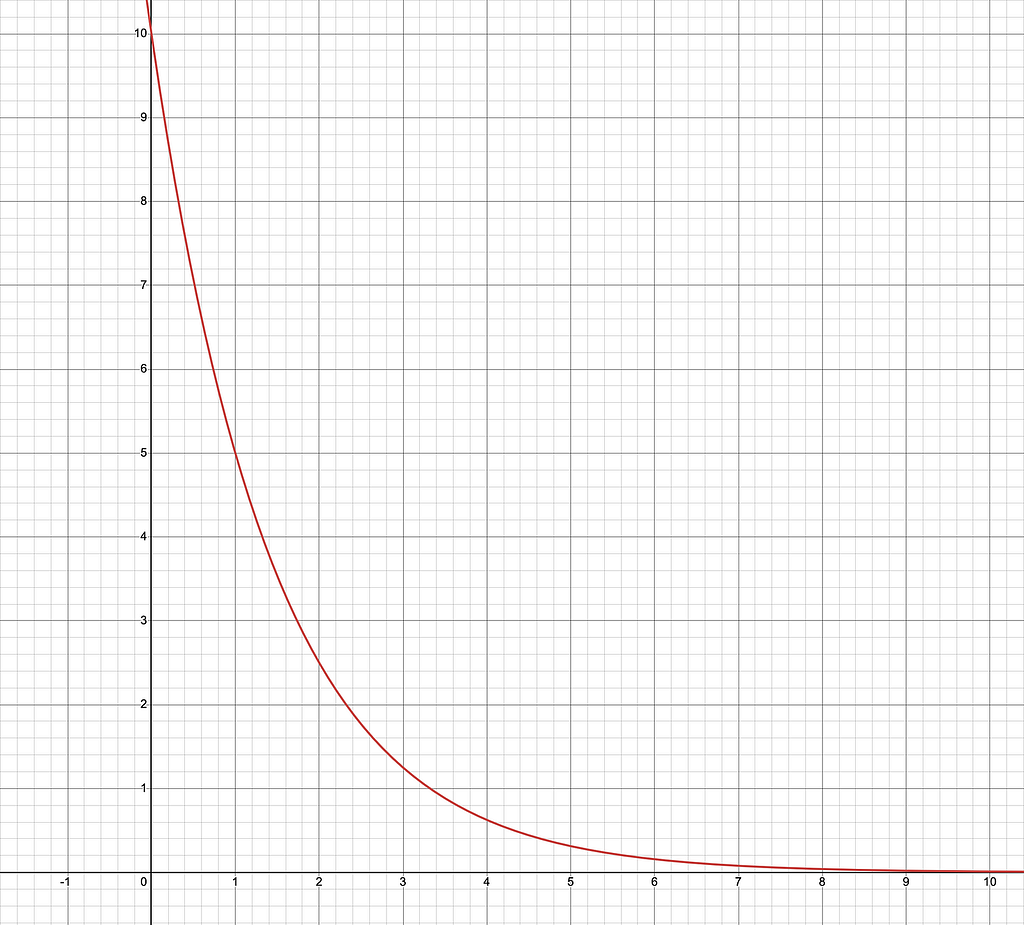
In this example the curve starts with Y=10 for X=0 and Y will decrease by 50% every time X increases by 1. The area under the curve represents the potential combinations of procedures an EDR may detect for a given technique, with the upper bound of X being the number of process injection procedures tested. It may appear at a glance that running 10 test cases is all that is needed to completely fill in our understanding of the EDR, but if you take a closer look you will see that the curve never actually reaches the X axis.

This is illustrating that the area underneath the line is actually infinite because the potential number of procedures for performing process injection is infinite and thus our possible combinations for which of those procedures an EDR may detect is also infinite.. In reality, there certainly is a limit to the different ways process injection may be performed, but for the purposes of testing and measuring, we will likely never know what that limit is.
All of that aside, knowing the infinite possible number, the reality is that the real number of total procedures for performing process injection are probably much lower than that. If we run a single test on a single procedure, we can plot our knowledge gained on the curve.

What about if we run 7 tests on 7 different procedures?

In regards to a specific technique, we can be significantly more certain now about what procedures our EDR can, and cannot, detect.
I want to stress again that this doesn’t show an increase in detection coverage of process injection for the EDR itself — that’s not what we are testing. This is an increase in your knowledge of the EDR’s capability surrounding process injection.
I understand that this post ignores any kind of weighting for each of the procedures. As an example, it may be more likely that you see standard shellcode injection than APC injection. I understand that, but since I am not tracking a desired state of coverage for each procedure, it’s not strictly relevant to the current discussion.
(Lack of) Information Warfare
Recently, I have been reading “The User Illusion” by Tor Nørretranders. In Chapter 2, titled “Throwing Away Information,” he shares an example of information loss in the context of grocery shopping.
When you go to the grocery and fill up a cart full of food, you check out, and they hand you a receipt for $218.52 — that receipt carries with it the full list of items you used to reach that total. Three months later, you check your credit card statement and you see a charge at Walmart for $218.52. If I asked you to go back to Walmart, armed with only that information, and recreate your exact cart of groceries, could you do it?
I would venture to guess that you couldn’t. There are far too many possibilities in Walmart that add up to $218.52 — as Tor says in the book:
But in fact there is far less information in the result than in the problem: After all, there are lots of different combinations of goods that can lead to the same total price. But that does not mean you can guess what is in each basket if you know only the price.
— The User Illusion, Tor Nørretranders
We make these kinds of generalizations on a day-to-day basis, but often without realizing or caring about the information we are leaving behind. Tor uses the example of temperature to convey this. When someone asks what the temperature is outside, and you respond with 75 degrees, you ignore the immeasurable number of potential states of matter and molecules required to place the temperature at 75 degrees. In this case, you don’t really care, you just want to know if you should wear a jacket or not — the information conveyed was sufficient, and the discarded information was not relevant. Even if you wanted to know, there is no way to reverse engineer the exact state from the resulting temperature.
How is this relevant to our EDR and purple team? Similar to the charge on your credit card, if an EDR makes a claim to “detect” process injection, then there are upwards of sixty-four different combinations of “detection” (based just on the six procedures I used earlier for illustration) that can lead the vendor to make that claim. Luckily, we can use something like a purple team assessment to successfully reverse engineer a representative set of results that could have led the vendor to make that statement.
The truth is that the vendor has already done this as well. The likelihood that they released a product incapable of detecting some form of process injection, and yet claim to do so, is quite low; however, most, if not all, vendors are not forthcoming in giving you the “receipt” of their testing. They may point to something like the aforementioned Mitre ATT&CK Evaluations as a facsimile for a true receipt, but the detail and depth of that testing I would argue is insufficient for assessing the true capability of an EDR, and as a result, your ability to secure your enterprise with it.
Conclusion
If you think back to our original pretend EDR marketing graphic, knowing what we know now, perhaps it should look more like this:

Now we know what set of possible data lies behind the shiny marketing and catchy buzzwords — but the only way to get to that data is to test different procedures, and as many of them as possible (within reason).
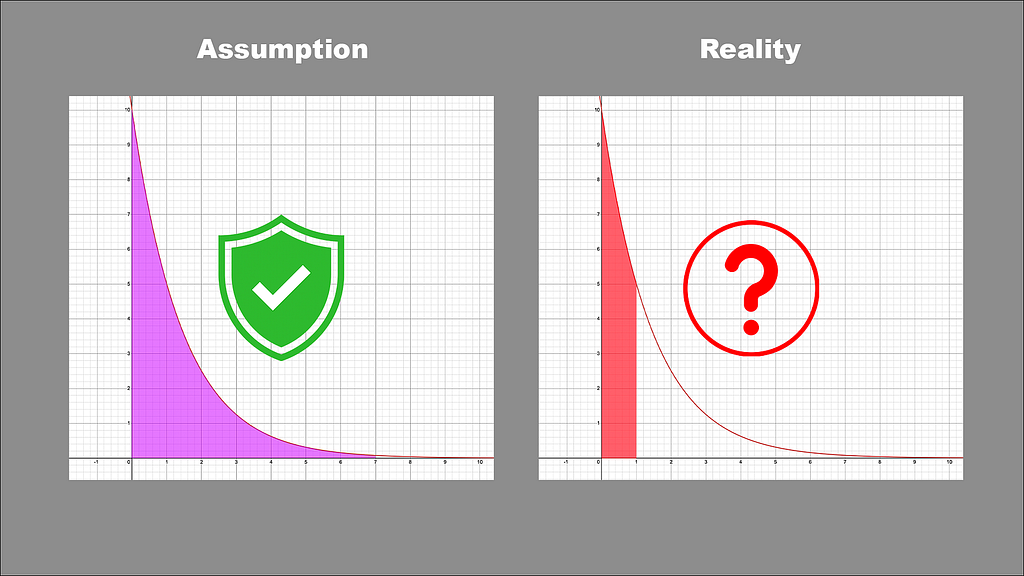
The question is, would you rather make the assumption, or know the reality?
Thanks:
To Infinity and Beyond! was originally published in Posts By SpecterOps Team Members on Medium, where people are continuing the conversation by highlighting and responding to this story.