Taming the Attack Graph: A Many Subgraphs Approach to Attack Path Analysis
TL;DR This blog presents a framework using technology subgraphs, decomposition, and graph abstraction to model hybrid attack paths and scale attack path management across enterprise technology platforms. I am also releasing SecretHound to model secrets using BloodHound OpenGraph.
Backstory
While performing a recent red team assessment, my team came across the GitHub Secret Scanning service. This service looks for known secret types committed to repositories. After compromising a GitHub token with org admin permissions, we listed all secret scanning alerts for the GitHub organization. The alerts included the secrets in plaintext.
The organization remediated many of the alerts, but we still recovered some valid credentials from the active alerts. We were pursuing a specific objective that required GCP access, so we focused on GCP service account credentials. We cycled through the recovered credentials until we found one with the roles and access needed to accomplish our objective.
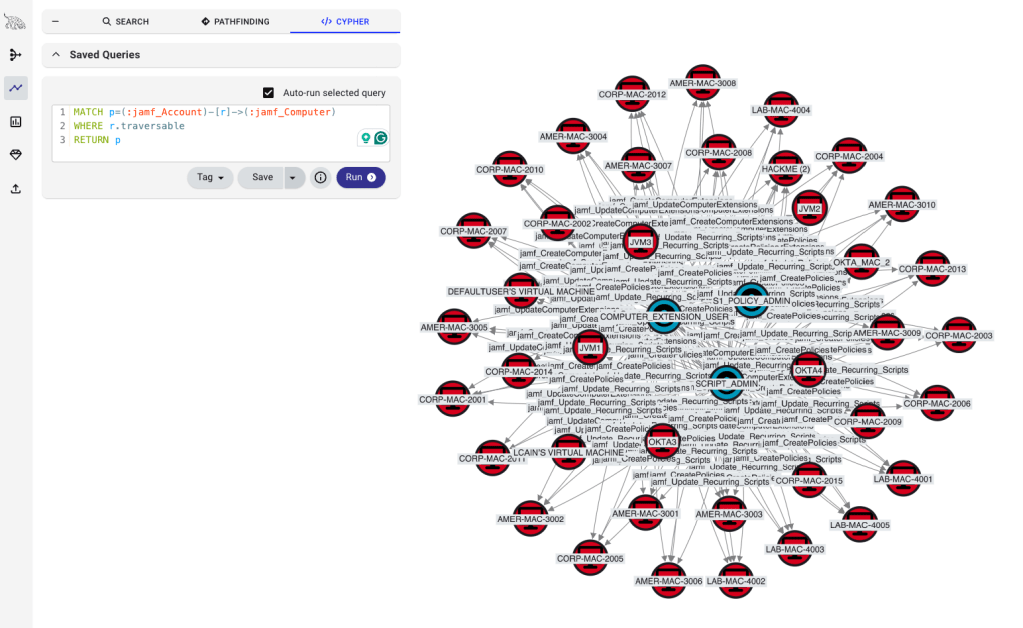
Later, during reporting, I was working on an attack path diagram to include in the report. Part of this step involved describing the attack path in a Cypher query using OpenGraph. As I worked through creating this query, I encountered a problem: the GitHub secret scanner node didn’t fit my existing mental model of the attack graph. In traditional attack graphs, nodes typically connect to one or maybe a handful of targets. Most of the hybrid attack paths (i.e., edges between technology subgraphs) were from nodes in one technology subgraph to nodes in another technology subgraph: a one-to-one relationship at the subgraph level. The secret scanner was different. It created hybrid attack paths to multiple technology platforms simultaneously.
I reached out to my colleague Jared Atkinson, who wrote the BloodHound OpenGraph extension for GitHub called GitHound. When describing the problem, he referred to the secret scanner we observed during the assessment as a “credential watering hole”. This was a single location containing credentials for many different systems in distinct technology subgraphs. This metaphor helped, but the graph representation challenge remained.
The scale of the problem became clearer when I considered the secret types in the alerts. The alerts we observed represented a subset of all possible secret types you could commit to a repository. To use numerical figures: imagine there are 1,000 possible secret types and we observed 100 of them. During the assessment, we only used one secret type to reach our objective, but how should this be modeled? A single GitHub secret scanner node potentially connected to dozens or hundreds of target systems across different technology platforms. This wasn’t a simple edge; it was a fan-out pattern that traditional attack graph visualization couldn’t adequately capture.
Sidenote: CorvaLabs opened an issue in GitHound about GitHub secret scanning. They also did some amazing work porting the GitHound PowerShell collector to Python. GitHound now accounts for the GitHub secret scanning service.
Deconstructing the Model
Graphing One Secret Type
Let’s start with the simplest case: a single secret type. During our assessment, we walked from the GitHub Secret Scanner node to a GCP Service Account node via a single ContainsCredentialsFor edge (Figure 1).
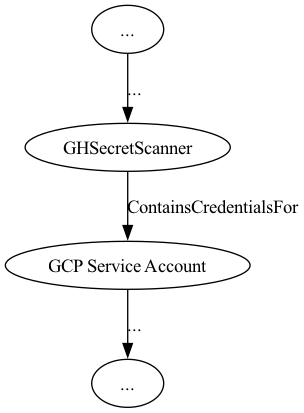
Figure 1 – ContainsCredentialFor Edge
This edge connects two distinct technology subgraphs. GitHub forms one subgraph, while GCP forms another. An edge that crosses between technology subgraphs is called a hybrid attack path: a concept Justin Kohler explores in his blog post (Figure 2).
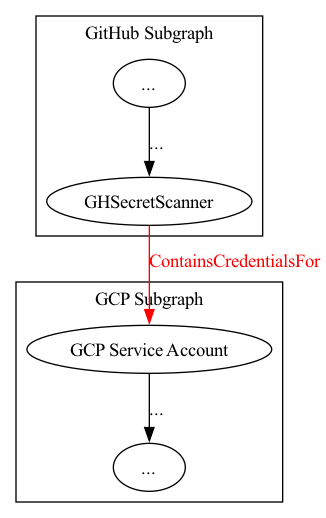
Figure 2 – Subgraphs with Hybrid Attack Path
Graphing X Secret Types
Enterprise environments are more complex. The secret scanner could contain different credential types for GCP service accounts, Active Directory users, Azure service principals, etc. Each credential type creates its own hybrid attack path to a different technology subgraph (Figure 3).
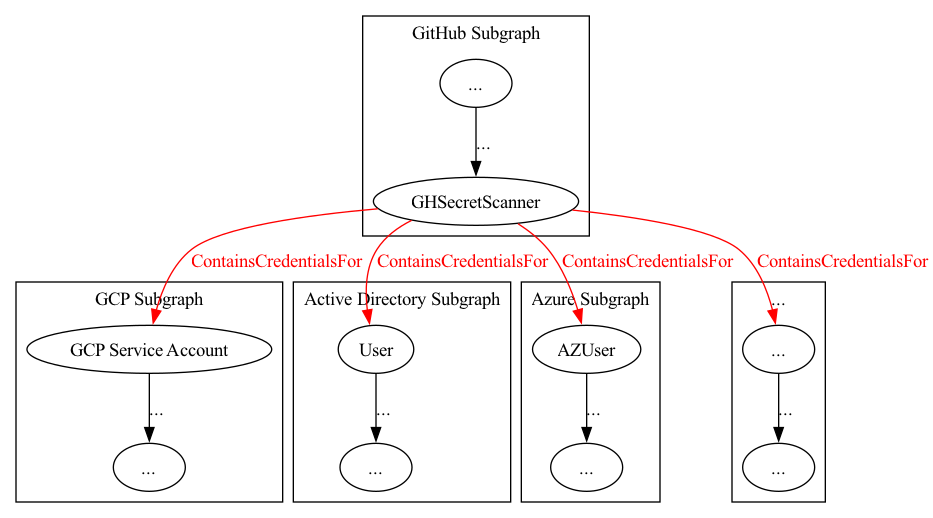
Figure 3 – Arbitrary Number of Secret Types
This fan-out pattern creates a visualization challenge. How do we represent a single node that simultaneously provides access to dozens of different platforms?
To better understand this pattern, we can decompose the GHSecretScanner node into its component parts. The GitHub secret scanning service creates individual alerts, one per discovered credential. Each alert contains the plaintext credential committed to a repository. This creates a one-to-one correspondence where one alert maps to one identity in the target technology subgraph (Figure 4). Additionally, each alert corresponds to a repository. This second correspondence is not depicted, but is how GitHound currently addresses the secret scanner alerts.

Figure 4 – Correspondence of Alerts to Identities in Subgraphs
This attack path demonstrates the interconnectedness of modern enterprises and the power of the BloodHound OpenGraph ecosystem. In our scenario, we have gained access to four distinct technology subgraphs (and potentially others in the …), each with corresponding collectors: SharpHound for Active Directory, AzureHound for Azure, GCP-Hound for GCP, and GitHound for GitHub. The recent addition of GCP-Hound to the OpenGraph community is particularly significant – developed by Faiz Karim, it enables modeling of IAM permissions and attack paths in GCP environments using BloodHound OpenGraph. As the community continues building collectors for additional platforms, our ability to identify and analyze hybrid attack paths across the enterprise technology stack will only improve.
Graph Abstraction for Visualization
At this point, our graph contains multiple technology subgraphs with numerous hybrid attack paths between them. To manage this complexity, we can adjust our level of detail using two complementary techniques:
- Decomposition – Breaking nodes into component parts to zoom in on internal structure
- Graph abstraction – Collapsing subgraphs into representative nodes to zoom out for high-level patterns
We already used decomposition to examine the GHSecretScanner node. Now we’ll apply graph abstraction to simplify the overall visualization. We can collapse each technology subgraph into a single representative node (Figure 5).
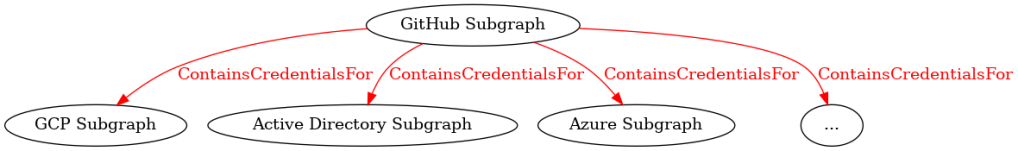
Figure 5 – Technology Subgraphs Abstracted to Single Nodes
This abstracted view clearly shows hybrid attack paths flowing from the GitHub subgraph to multiple technology platforms. We can apply this technique recursively, grouping related technologies into higher-level categories for even broader views (Figure 6).
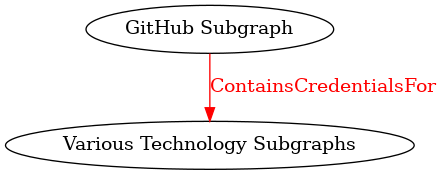
Figure 6 – Additional Graph Abstraction
Credential Watering Holes
GitHub Secret Scanner is just one example of a credential watering hole. Other common watering holes include:
- Password vaults (1Password*, LastPass, corporate password managers)
- File shares** containing configuration files (.env, config.yaml, credentials.json)
- CI/CD platforms (Jenkins credentials, GitLab CI variables, GitHub Actions secrets)
- Configuration management systems (Ansible Vault, Terraform state files)
- Container registries with embedded secrets
- Wikis*** and ticketing systems
* An OpenGraph extension exists for 1Password. Check it out here.
** An OpenGraph extension exists for file shares. Check it out here.
*** An OpenGraph extension exists for Atlassian. Check it out here.
We can start modeling all of these watering holes as a subgraph of various starting subgraphs (Figure 7).
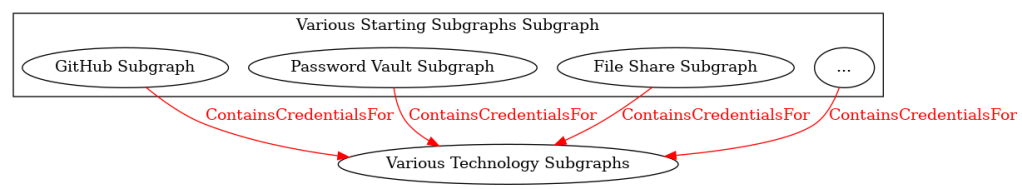
Figure 7 – Other Subgraphs That May Contain Credentials
Credential watering holes represent high-value targets for both attackers and defenders. Each watering hole potentially creates hybrid attack paths to multiple technology subgraphs simultaneously. Organizations that identify and secure these nodes before attackers discover them gain significant defensive advantage.
Subgraph-Local Tier Zero Nodes
Within each technology subgraph, certain nodes possess the highest level of administrative privilege for that platform. I call these subgraph-local tier zero nodes which are the highest level admin/root principals within their respective technology domain. Compromising these nodes represents both privilege escalation and credential access in the MITRE ATT&CK framework and can facilitate lateral movement. Table 1 has some examples.
| Technology Subgraph | Subgraph-Local Tier Zero Nodes |
| Active Directory | Domain Admins |
| Entra ID | Global Administrator |
| AWS | Root Account |
| GitHub Enterprise | Org Admin and Enterprise Admin |
| GCP | Organization Administrator |
| Linux System | Local Root Account |
Table 1 – Subgraph-Local Tier Zero Examples
Subgraph-local tier zero access provides comprehensive control within a technology platform. An attacker with Domain Admin in Active Directory owns the domain. Similarly, our GitHub Enterprise Org Admin access granted visibility into all secret scanning alerts, exposing credentials across GCP, Azure, and other platforms. No matter the subgraph, if an attacker can gain control of a local tier zero node, then they can view the entire local subgraph as if it is a single node. This is an example of graph abstraction.
Reassembling the Model
Using technology subgraphs, graph abstraction, decomposition, and subgraph-local tier zero nodes, we can expand the attack graph horizontally across all platforms found in enterprise environments (Figure 8). The number of enterprise technologies is large but finite. Each technology subgraph will contain subgraph-local tier zero nodes to secure and may introduce hybrid attack paths to manage.
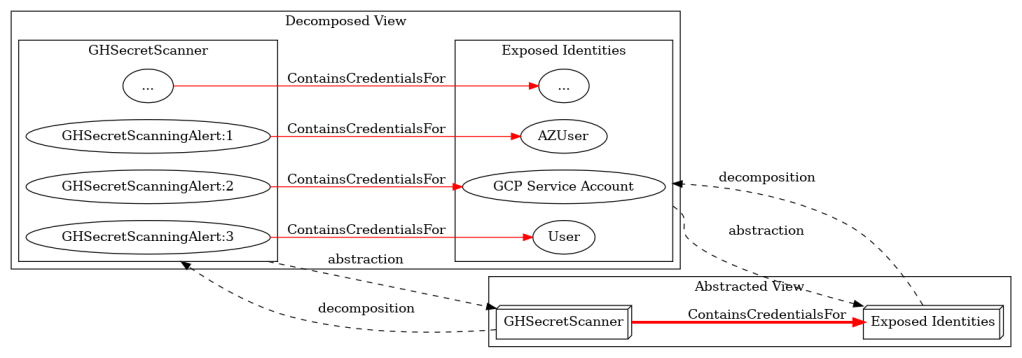
Figure 8 – Graph Abstraction and Decomposition
Comprehensive hybrid attack path management requires modeling every technology subgraph and identifying all subgraph-local tier zero nodes within them. OpenGraph provides the framework to model these relationships systematically across the entire enterprise technology stack. To get started, I am releasing SecretHound: a BloodHound OpenGraph extension for secrets. Check it out here.