Janus: Listen to Your Logs

TLDR: Operators are telling you what to build. Janus listens. Every failed command, retry, and workaround during an engagement is useful data but it usually gets deleted and forgotten. Janus surfaces that data instead, showing your team where your tooling breaks, where operators lose time, and what you could automate next. To jump right in, head to the repo and follow the README: https://github.com/SpecterOps/Janus
Introduction
On almost every engagement, a command will fail and an operator will tweak it until it works. A few weeks later, on a different engagement, they will encounter the same issue and cycle through that process again. None of this repetitive friction gets surfaced because it dies in scratch notes and logs. The issue is not one failure, but rather a compounding of failures that makes us lose hours on engagements.
Janus exists to capture and surface that friction, turning errors into something useful. It does this by parsing logs from command and control (C2) servers, showing how tools actually behave during operations and not how we think they behave. Janus performs its entire analysis without the use of LLMs, ensuring engagement data remains fully controlled. LLMs are an optional layer for querying and interaction, where you can filter or redact any shared data in accordance with organizational policies. From this analysis, teams can direct resources to fix those issues, inform operators, or build new tools to reduce the friction. In turn, this provides benefits for every layer of operations.
Use Case by Role
Operators
Typing the same failing command again because you forgot it failed last month is not a skill issue but rather a memory problem that shouldn’t exist. Janus tracks what tool worked, what didn’t, and in what context. When you are back in a similar situation, that operational knowledge can be surfaced instead of sitting buried in a log file nobody reads and is soon to be destroyed. Janus highlights where the problems are for quicker debugging, allowing you more time for operating.
Offensive Security Engineers
Currently, a good amount of tooling decisions are often driven by instinct and anecdote. Janus gives engineering grounded direction by using context from operations. By doing this, we help teams understand:
- Which tools should be updated vs. retired
- When and why tool failures occur
- Which techniques are being improvised due to missing capabilities
- What arguments caused a Beacon object file (BOF) to crash an agent
- What command ran before a callback stopped checking in
- What activity later correlated with detection or prevention
Instead of guessing where to spend development resources, teams can prioritize fixing recurring friction that was once invisible across engagements.
Leadership or Management
Most debriefs are verbally held then transcribed, which turns lessons learned into something teams have to remember. Three weeks after an engagement ends, the operator who hit a blocker on one small tool has moved onto their next project and does not remember the specifics. Janus gives leadership the data layer that has been missing, and it answers:
- How much time (and therefore cost) is lost to tool failures, retries, and operator workarounds
- Which parts of the engagement hold the most variability in timelines and delivery?
- Where are we paying an “efficiency tax” due to unreliable tooling?
When a client asks why something took longer than expected, you now have an answer supplemented with data instead of just words.
LLMs and Automation
Overall, there is too much data in engagement logs for anyone to manually review, causing a bottleneck for analysis. To combat this issue, Janus produces normalized JSON for every task and result, making operational data usable by LLMs. Users should ensure any data shared with LLM services aligns with their organization’s data handling policies. For sensitive environments, this can be done using self-hosted models or hosted options such as Amazon Bedrock. Instead of digging through logs, teams can talk to their operations with natural language. This turns raw telemetry into something you can ask questions about, not just stare at and store. Over time, the analyses and conversations with engagement data will create an evolving knowledge base.
Philosophy
Janus is the god of all beginnings, transitions, and endings. His imagery symbolizes the duality of change, allowing him to see both what has passed and what is to come. This project is doing just that: finding what boundaries tools are hitting, what is blocking operators, and what new beginnings teams can create from understanding how we operate. In summary, Janus is looking at our previous paths and using them to create new ones.
Design and Scope
For quick adoption and execution, Janus mirrors the architecture of the Mythic C2 Framework:
- Containerized and Docker-based deployment
- CLI ergonomics aligned with mythic-cli
- Surface high-fidelity operational analysis with zero friction
- Act as a persistent decision layer for tool adoption, not a disposable utility
Data Collection
The data collection pipeline follows the same workflow for every source. Janus requires a data source or a normalized events json file.
- Ingest data from supported sources
- Mythic: GraphQL
- Ghostwriter: GraphQL
- Cobalt Strike: REST API
- Normalize into a unified event model
- Analyze using model-driven analyzers
Janus does not parse files, screenshots, or exfiltrated artifacts. Once ingested, the data gets modeled into task and result models.
Data Privacy
Data retention and redaction with operational data is a valid concern. Janus provides a configurable data handling module, known as retention controls, to help with this issue. Sensitive fields can be kept, reduced, or removed before artifacts are written, with the policies being recorded so each run can be audited. This lets teams limit sensitive data exposure while preserving enough context for analysis and tooling. These controls apply to normalized Janus artifacts only. They do not sanitize exports from the data source or replace operator responsibilities around data handling.
Task Model
Represents commands issued to the C2.
Schema-Required Fields
| Field | Description |
| task_id | Task identifier within the operation |
| timestamp | ISO 8601 (submission time) |
| command_name | Command invoked |
Common Parser-Populated Fields
These are emitted by current parsers and helpful for detailed analysis, but are not the validation boundary.
| Field | Description |
| event_type | “task” |
| source | source identifier such as “mythic”, “ghostwriter”, or “cobaltstrike” |
| operation_id | Operation or project ID |
| callback_id | Callback (implant session) identifier |
| callback_display_id | Human-readable or source-derived callback label |
| display_id | Human-readable or synthetic task number |
| tool_name | Tool or module name |
| arguments_raw | Raw argument payload |
Optional Fields
The fields help enrich analysis by providing more detail into sub tasks or timing intelligence.
| Field | Description |
| processing_timestamp | When agent picked up the task |
| callback_sleep_info | Callback sleep interval (e.g., “5s”) |
| issued_command_name | Actual executed command if different |
| parent_task_id | Parent task ID |
| orphaned_subtask | true if parent is unresolved |
| c2_task_id | Source-specific cross-link identifier today; currently overloaded across sources |
Result Model
Represents the response to a task.
Schema-Required Fields
| Field | Description |
| task_id | Links to corresponding task |
| timestamp | ISO 8601 (completion or last response time) |
| status | “success”, “error”, or “unknown” |
| output_text | Raw, concatenated output text; may be empty |
Common Parser-Populated Fields
| Field | Description |
| event_type | “result” |
| source | Parser/source identifier |
| operation_id | Operation or project ID |
Optional Fields
| Field | Description |
| dispatch_failed | true if task failed before reaching the agent |
| terminal_inferred_error | true if Janus promotes a terminal unknown to error |
Output Handling
- output_text may be selectively retained (e.g., errors only) to reduce payload size
- Full raw exports should remain available outside normalized data
- Ghostwriter currently preserves chronology best, but its normalized result status is conservative and usually unknown
- dispatch_failed distinguishes pre-execution failure from agent execution failure
Design Principle
Everything is downstream of the data model, therefore:
- With chronology you can only analyze timing, sequencing, repetition, parameter issues
- With full telemetry (output + metadata) you can identify failing tools, degraded sessions, and execution quality
Knowing this strict data model, do not add more sources blindly. When adding a source, make sure they are instrumented to conform to the model.
Data Analysis
The value of these analyzers depends on what you’re trying to improve. If your goal is to get a tool to consistently work, you would focus on command-level analysis to understand correct execution patterns. If your goal is automation, you would look toward tooling-level analysis. For example, argument-position-profile helps you identify repeatable argument structures, making it easier to standardize or generate inputs for automated workflows. This repo provides Claude/Codex skills with architecture details to allow for quick construction of custom analyzers. Janus groups analyzers by how you think about an engagement, each answering a respective question:
Summary Analysis
A high-level view of the operation:
- summary-visualization – What does the operation look like across time, volume, and status?
Command Analysis
Where execution starts to break down:
- command-failure-summary – Which commands fail most, and how often?
- command-retry-success – Which commands need repeated tuning to succeed?
- command-duration – How long do commands take and what is slow?
- outlier-context – What surrounds unusually slow commands?
- av-tracker – What tool or command got my Beacon killed, and which AV did it?
Workflow Analysis
This layer focuses on how operations unfold over time, where they break, and where time is lost:
- callback-health – Which implant sessions show instability, failure patterns, or crashes?
- dwell-time – Where are operators losing time between tasks?
- parameter-entropy – Which arguments look anomalous or out of place?
Tooling Analysis
This layer looks deep into how tools are used, identifying patterns that can be standardized or automated.
- argument-position-profile – What consistently appears at specific argument positions?
- tool-dump – Which subsets of commands or tools should be exported for downstream analysis or dataset generation?
Janus Demo
Let’s run through a full workflow on an operation to find where errors commonly occur so we can make a tooling decision based on evidence.
- To run any commands, we must first build the cli go binary or download from the latest release: make cli or https://github.com/SpecterOps/Janus/releases/
Then, we edit janus.yml with the source configuration. In this example, we are pulling from Mythic:
mythic:
  endpoint: "http://IP:7443/graphql/"
  api_token: "ey......"
  verify_tls: true # false for local/self-signed lab certs
  operation_id: 1
3. Execute ./janus-cli.exe pull to ingest task and result data from the configured source (might require admin to start), output:
Docker: image ready.
Docker: starting container (run) - output below
Preflight: connectivity/auth (Mythic)...
Preflight: OK
Operation: GKRAMER (ID: 1, slug: gkramer)
Output directory: out/complete/gkramer_20260402_152049 Tasks pulled: 15 Results pulled: 15 Status: success=13, error=1, unknown=1
4. Analyze the latest ingested data with ./janus-cli.exe analyze:
At this point, we have JSON files that can be piped into automation or LLM-assisted review. Here is a sample of this JSON:
"ps": {
"execution_count": 3,
"success_count": 1,
"error_count": 1,
"dispatch_error_count": 0,
"unknown_count": 1,
"failure_rate": 0.3333333333333333,
"callback_breakdown": {
"1": {
"callback_display_id": 1,
"task_count": 2,
"success_count": 0,
"error_count": 1,
"dispatch_error_count": 0,
"unknown_count": 1
},
"2": {
"callback_display_id": 2,
"task_count": 1,
"success_count": 1,
"error_count": 0,
"dispatch_error_count": 0,
"unknown_count": 0
}
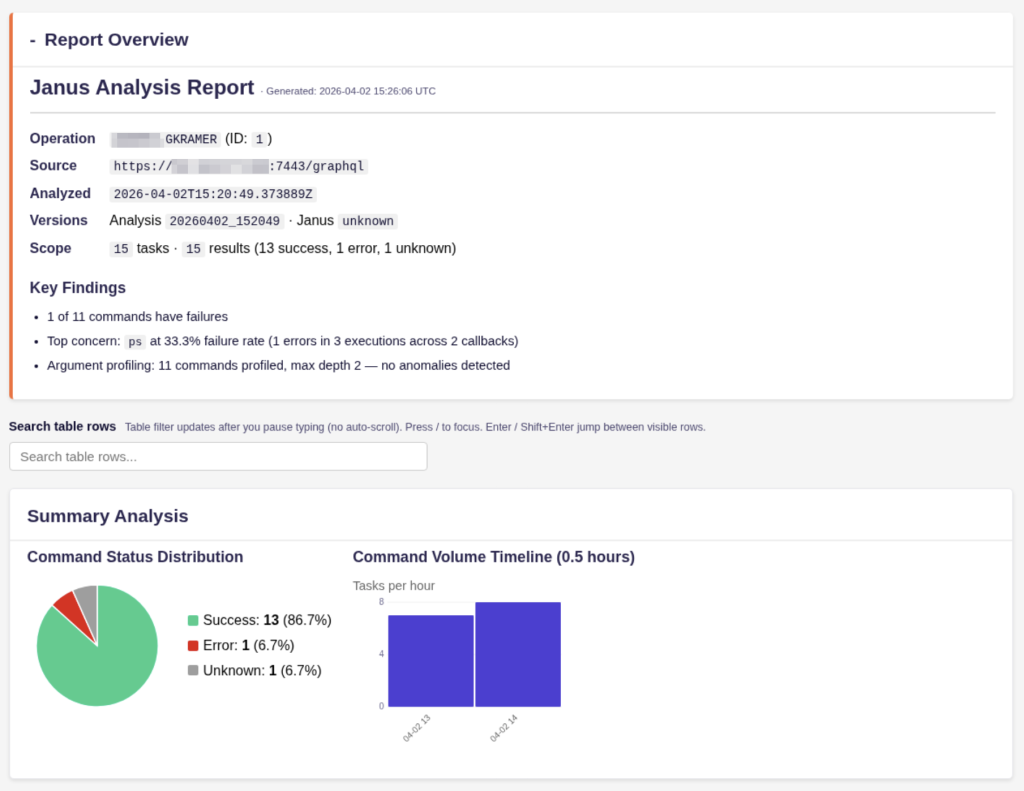
},4. Run ./janus-cli.exe report to generate an HTML report:
Docker: image ready.
Docker: starting container (html) - output below
HTML report generated: out/complete/gkramer_20260402_152049/report.html
Open report: file:///data/out/complete/gkramer_20260402_152049/report.html
   summary-visualization
   command-failure-summary
   command-retry-success
   command-duration
   outlier-context
   callback-health
   av-tracker
   dwell-time
   parameter-entropy
   argument-position-profile
   tool-dump
Report: out/complete/gkramer_20260402_152049/report.html
5. View report and analysis data:
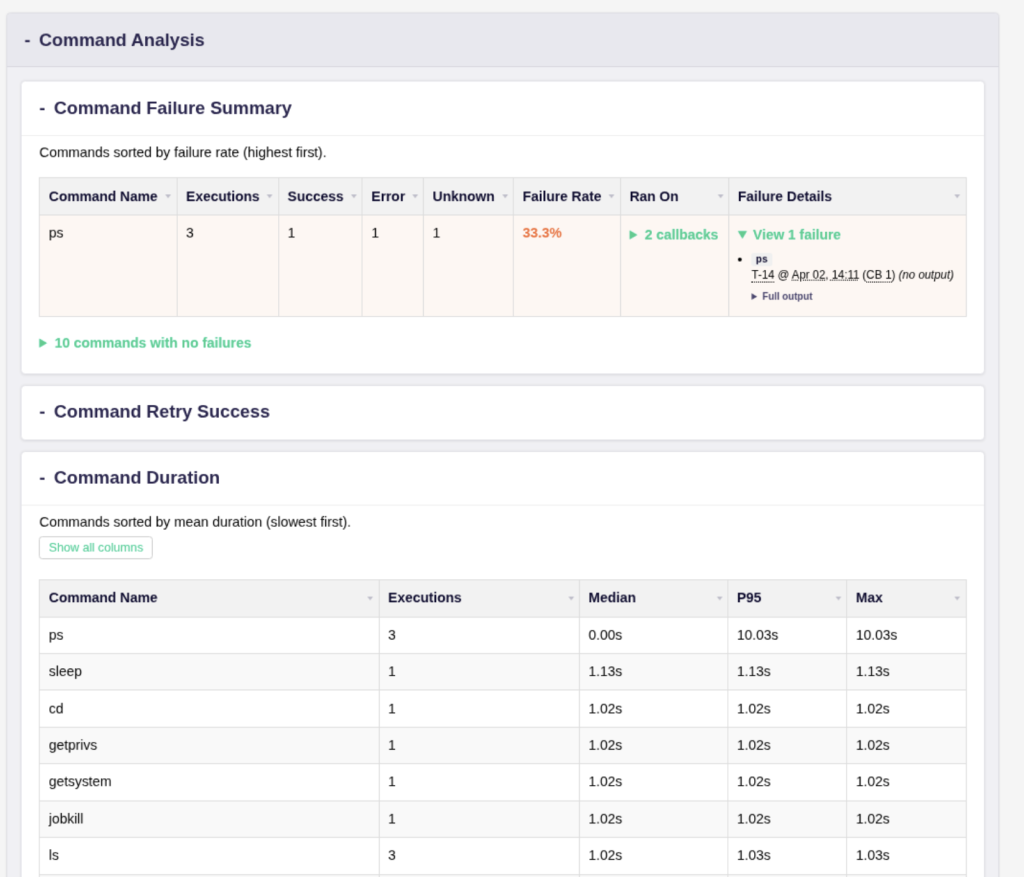
As you can see, there is an anomalous execution of ps that took almost 10 seconds, which isn’t normal. As an agent developer or red team engineer, this context would allow me to start an investigation into why the ps command took so long. Janus also helps determine if the issue was environmental or due to the quality of the tool.
Roadmap
- Expand on data sources
- CobaltStrike support is in early stage (REST API)
- Ghostwriter to use ExtraFields for higher fidelity analysis (adding status, sleep count)
- Expand analyzer library
- Claude and Codex skills for fast adoption by community
- Create dynamic application instead of static output
- Further AI analysis
- Chat with logs
- Streamed intelligence of all operations
Conclusion
Operators already generate the evidence for what needs to be fixed, automated, retired, or built next. Most teams just do not have a system that turns that evidence into feedback. Janus is meant to be that system.
Contact Information:
Linkedin – linkedin.com/in/gavin-kramer
Social Media – @atomiczsec