On Detection: From Tactical to Functional
In his 1931 paper “A Non-Aristotelian System and Its Necessity for Rigour in Mathematics and Physics,” Mathematician Alfred Korzybski introduced an idea that many today find helpful when dealing with complex systems. The idea is commonly referred to as “The map is not the territory,” and Korzybski lays it out according to the following points:
A.) A map may have a structure similar or dissimilar to the structure of the territory.
B.) Two similar structures have similar ‘logical’ characteristics. Thus, if in a correct map, Dresden is given as between Paris and Warsaw, a similar relation is found in the actual territory.
C.) A map is not the actual territory.
D.) An ideal map would contain the map of the map, the map of the map of the map, etc., endlessly…We may call this characteristic self-reflexiveness.
When we consider attacker tradecraft, we tend to think about it abstractly. What does it mean to “dump credentials from LSASS” or “Create a Golden Ticket”? Our understanding of these abstract concepts depends on the MAP we use to undergird them. If, as Korzybski’s second point states, our map does not share a similar structure to reality, then any conclusions we draw from the map will, by definition, be incorrect. How, then, should we build accurate maps of the “tradecraft territory?”
I believe the answer to that question can be derived from our old friend Plato, who, in his dialogue, Sophist, explores the definition of the form through the analysis of particulars. In our case, the form represents the tradecraft (technique or behavior) in question, for example, Process Injection; the particular is the tool or sample that implements the technique. Plato proposed that we can understand the form by understanding what the particulars have in common, “sameness,” and what differentiates them, “difference.” We can do this by analyzing tools that ostensibly perform Process Injection and “mapping” them to allow for comparison. This post describes our current approach to mapping tool implementations and how this mapping facilitates the comparison of the particulars.
Introduction
Over the past few months, I’ve been working with some colleagues at SpecterOps to develop our Purple Team service offering. One of the tasks that we’ve been focusing on is creating a model that allows us to represent the possible variations of an attack technique. The plan is to use this model for use case selection during our Purple Team assessment. To do this, we’ve applied many of the concepts described earlier in this series, and along the way, we’ve learned a lot about how to teach others to implement this approach. One person who helped me understand how to break down the analytical problem into bite-sized portions is Nathan D. When Nathan first worked with me, he did not have much experience with the analytical approach described in this series. His fresh perspective helped to identify areas where I was making logical leaps or did not represent the output well. As a result, he helped me create a new model or graph layout that I think is helpful and a bit more tangible for those just getting started.
Below is an image of the Tool Graph (yes, that is the really creative name I came up with). The idea is to analyze a single tool’s, or “particular” sample’s, implementation of a behavior to understand how it works and use that as a starting point to enumerate or discover additional variations. Over time, as more tools are analyzed, these graphs, or at least some of their components, can be combined to create a robust model of the different variations of each attack technique. It is a way to formalize our understanding of these variations instead of simply maintaining a disintegrated list of variations in our heads.
In this post, I want to walk you through the components of the Tool Graph, what the colors represent, and how you can make your own. So let’s dig in!
Our Tool of Interest
For this blog post, I will reference a sample shared by DGRonpa in their Process_Injection repository. This repository is an excellent resource for learning about many of the most common Process Injection variations. Today we will analyze their Shellcode_Injection.cpp sample, which implements the classic remote thread shellcode injection variation that most of us are familiar with.
Choosing a sample or tool to analyze is a significant source of consternation. Through this initiative, we have identified several important factors to consider, especially for analysts just getting started with this type of analysis. I plan to discuss these factors in a follow-up entry in the series.
Process_Injection/Shellcode_Injection.cpp at main · DGRonpa/Process_Injection
Function Chain
The first step in generating a Tool Graph is to map the sequence of the sample’s API function calls. This sequence is also known as a “function chain.” For this post, I selected a relatively simple sample so that identifying the Function Chain would be as easy as possible. If you want to see how this process works with a more complicated example, I recommend you check out Part 1 of this series, which looks at the function chain for the mimikatz sekurlsa::logonPasswords module.
For now, I’ve included a screenshot of the critical snippet of our sample below:
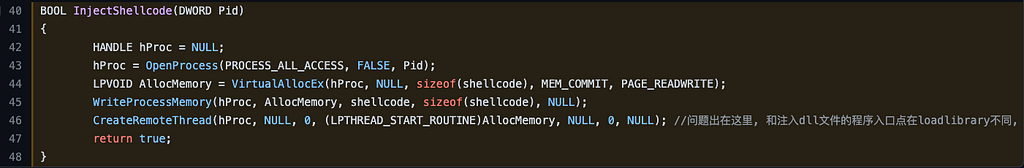
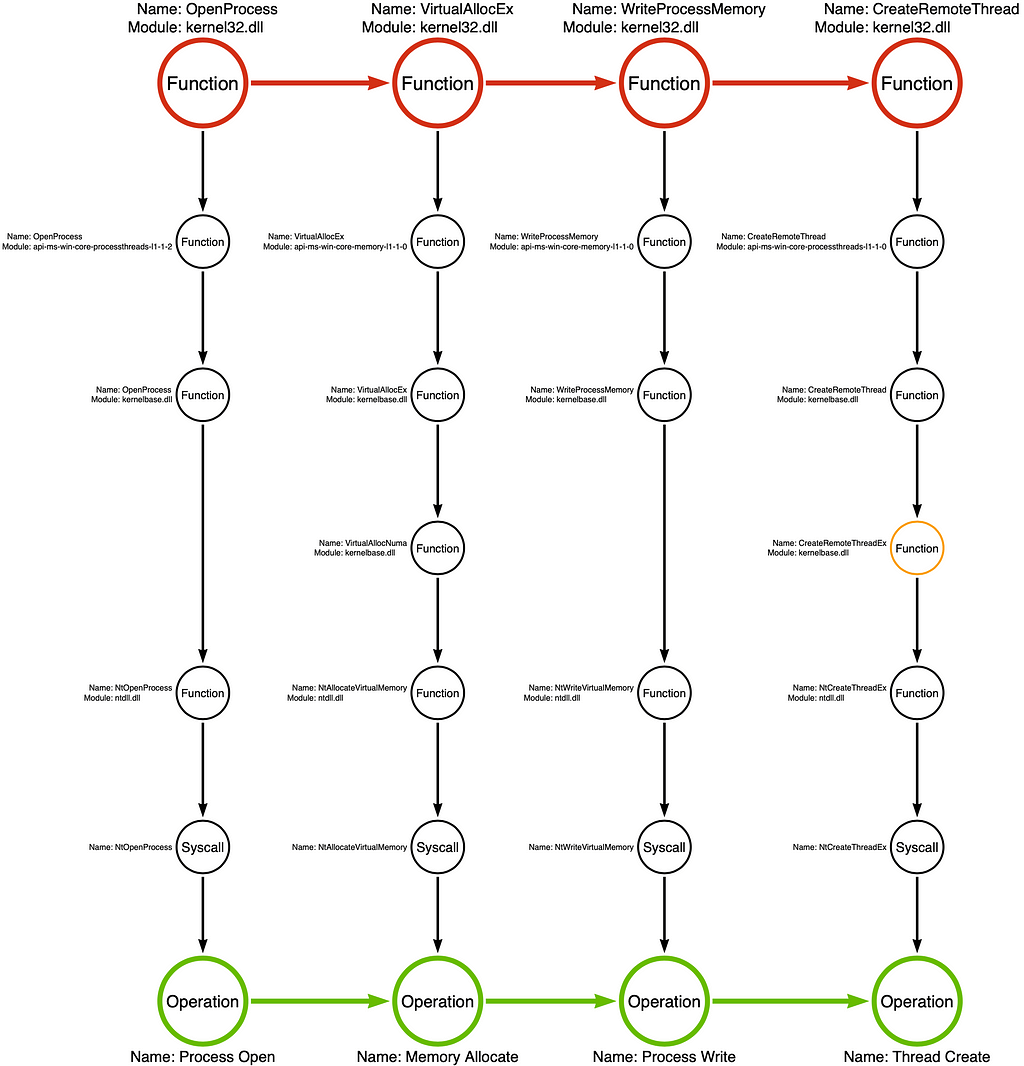
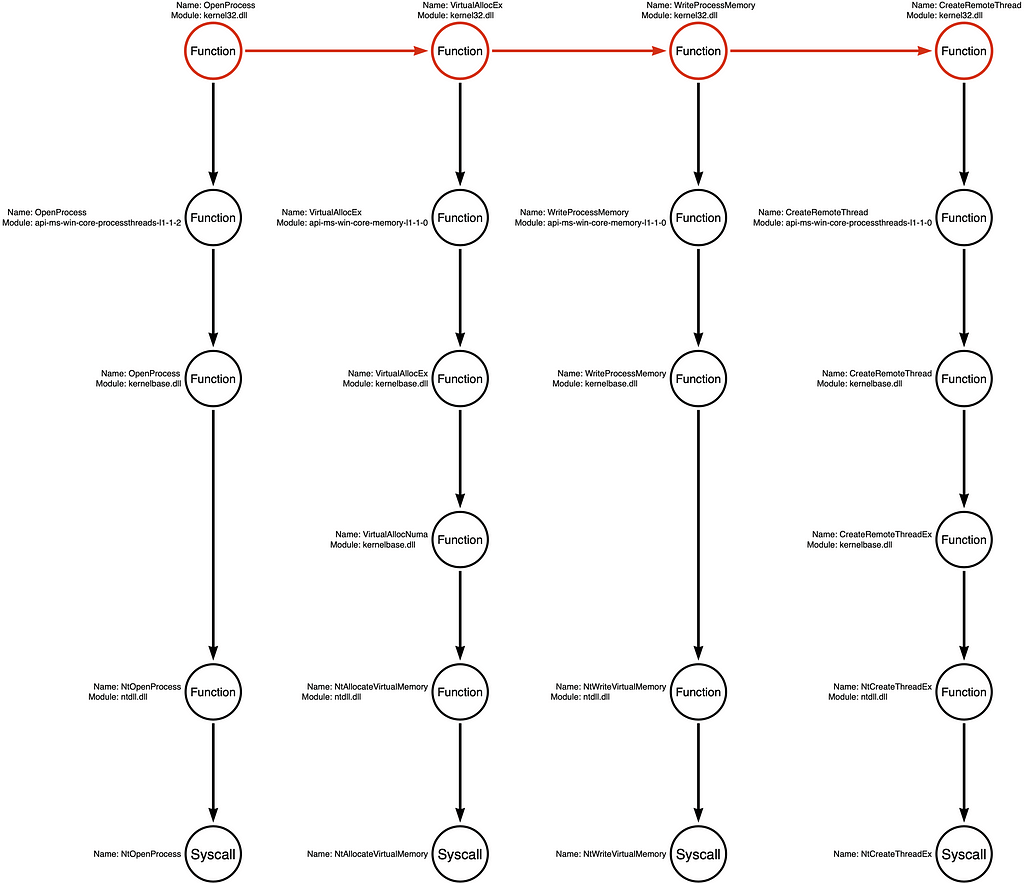
Notice that the InjectShellcode function calls four Windows API functions, OpenProcess, VirtualAllocEx, WriteProcessMemory, and CreateRemoteThread. Now that we’ve observed the specific sequence of functions the sample calls, we can graph them as a Function Chain:
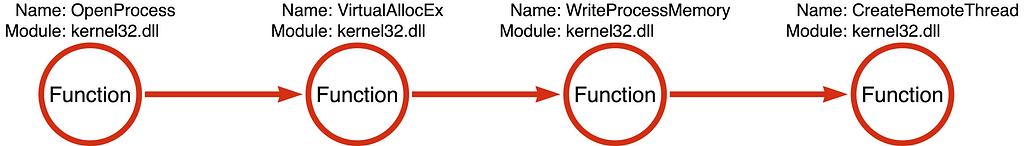
Note: All graphs are generated using APC Jones’ Arrow Tool at https://arrows.app
In the Tool Graph, the circles and arrows of the Function Chain are red.
Function Call Stack(s)
I remember hearing about this Function Chain or pattern when I started in the industry. I was told, “if you see OpenProcess, VirtualAllocEx, WriteProcessMemory, and CreateRemoteThread, it signifies Injection.” Over time, as I became more familiar with API programming, I realized that this perspective was somewhat low resolution. I found that while this specific pattern of functions may indicate injection, there are (many) alternative Function Chains that also indicate injection.
It reminds me of the saying that “all squares are rectangles, but not all rectangles are squares,” but this time, it is something like “all instances of the [function chain] are injection, but not all instances of injection are the [function chain].” One way we can expand our map of Function Chain variations is to explore the Function Call Stacks for each function in our particular Function Chain, namely kernel32!OpenProcess, kernel32!VirtualAllocEx, kernel32!WriteProcessMemory, and kernel32!CreateRemoteThread. If you are unfamiliar with Function Call Stacks, check out my Understanding the Function Call Stack post, which offers an in-depth exploration of this phenomenon.
Note: Before we continue, there is a significant change between how I graph the Function Call Stack in the original post and how I integrate it into the Tool Graph. To differentiate between the Function Chain (the literal sequence of functions that the tool calls) and the Function Call Stack (the functions that are called implicitly/behind the scenes as a subsequent action of a higher level explicit function call), we represent the “Function Chain” horizontally and the “Function Call Stack” vertically.
Below, you will see the first Function Call Stack for kernel32!OpenProcess, integrated into the Tool Graph:
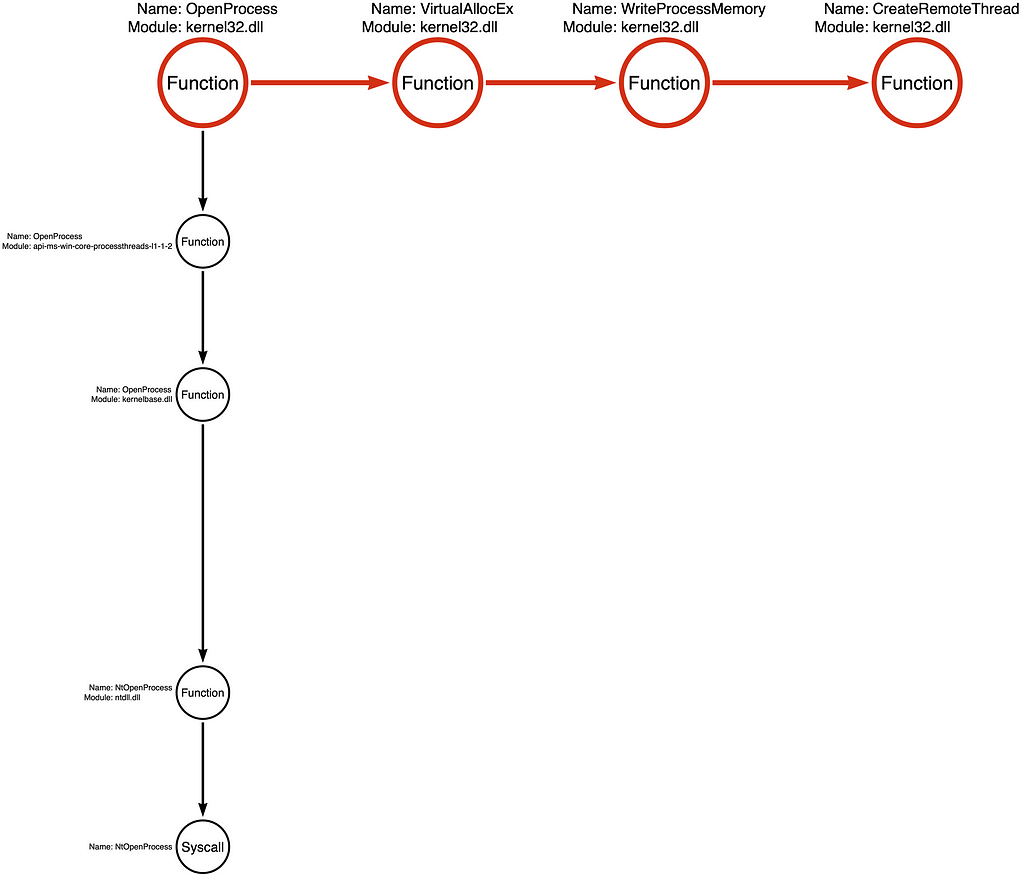
We can then integrate the Function Call Stack for each additional function in the Function Chain, as shown below:
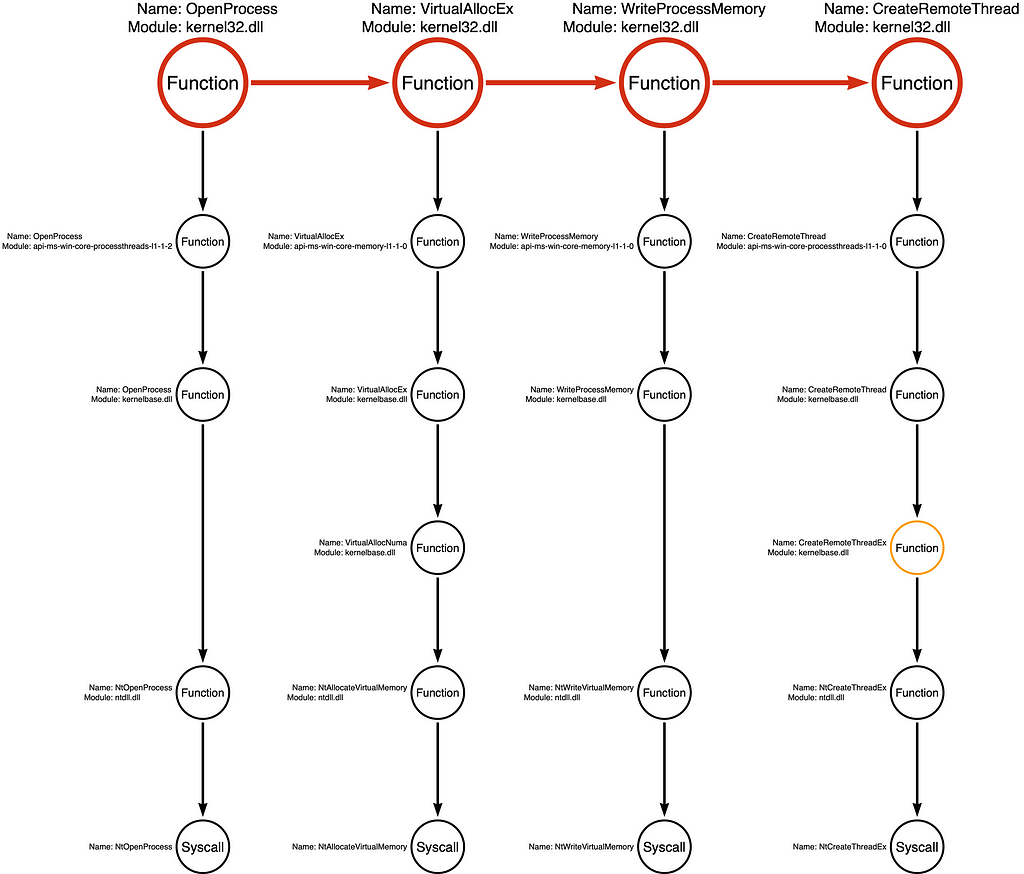
Note: Some functions are much more complicated than others because they may call multiple subsequent functions. In some cases, we include all subsequent functions in our analysis, but in other cases, we only have the most relevant sub-stack. To signify incomplete function analysis, we color the function’s circle orange, as shown with kernelbase!CreateRemoteThreadEx in this example.
Analysis of Variations
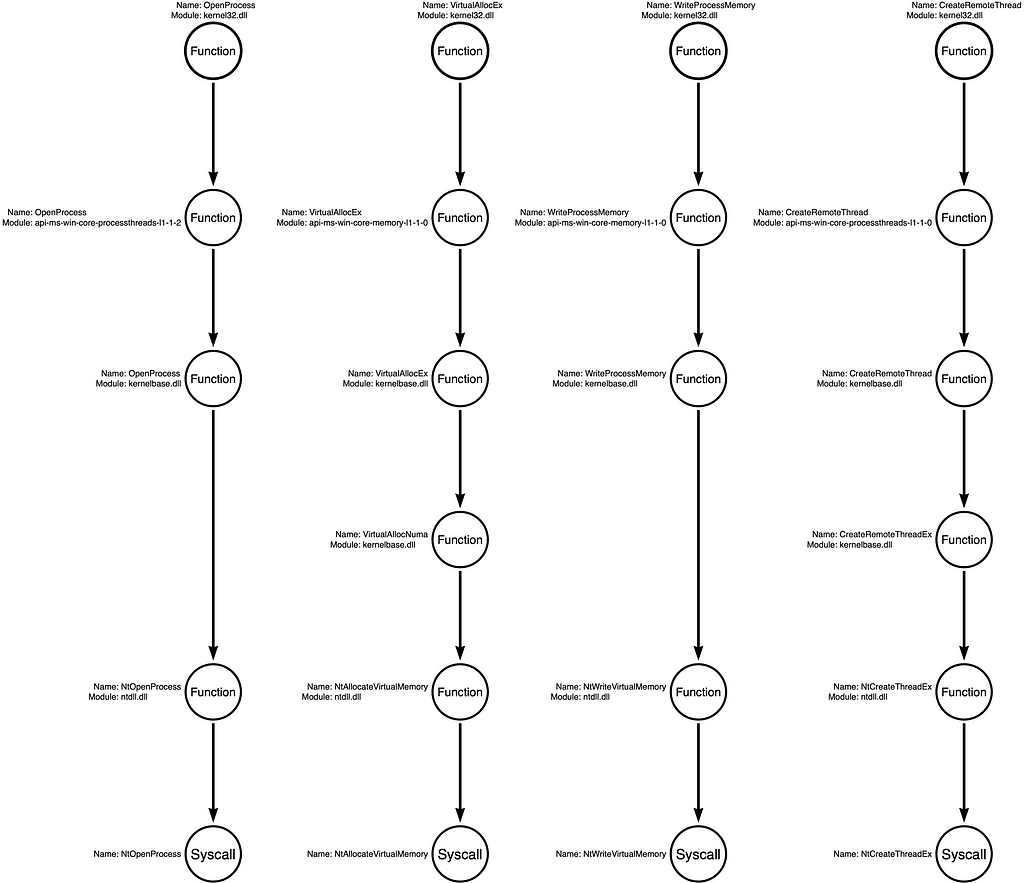
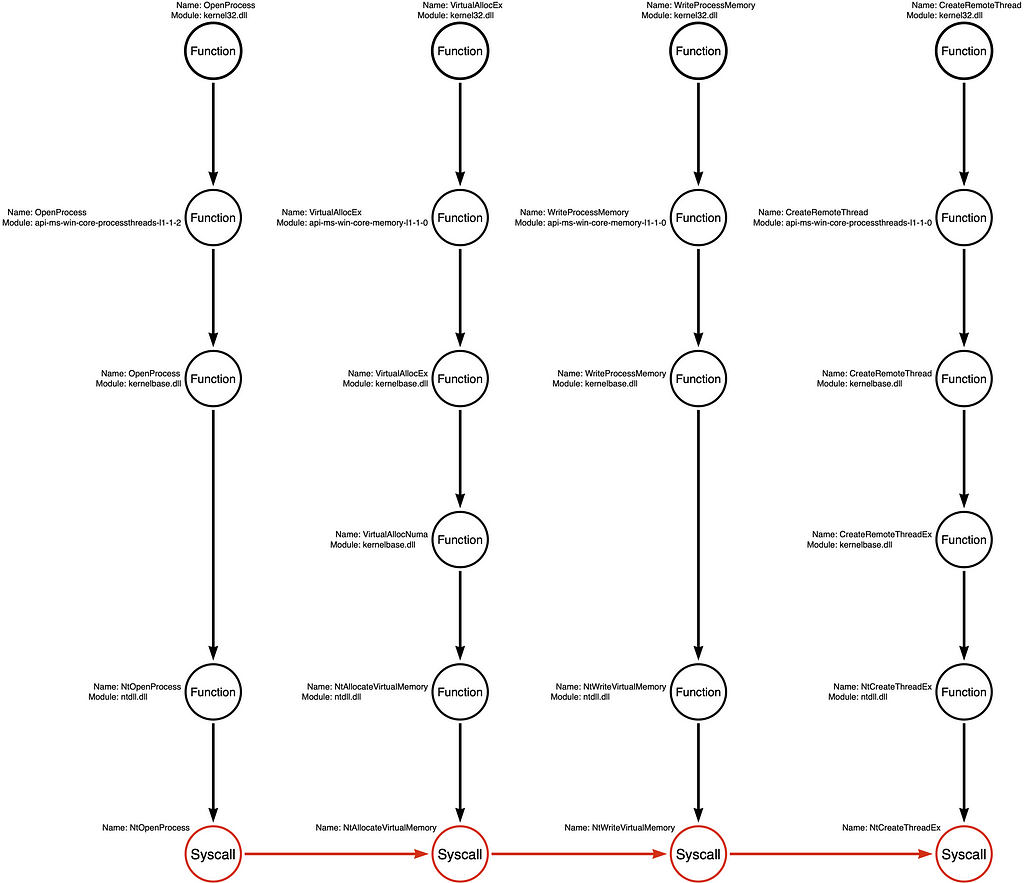
Once we have enumerated all the Function Call Stacks, we can analyze all the possible “functional variations” represented by our current graph. Generally, a developer can select any function in each stack. For example, you can choose any function from call stack 1 and combine it with any function in call stacks 2, 3, and 4 to create a functioning application. We see that Call Stack 1 has five (5) functions, Call Stack 2 has six (6) functions, Call Stack 3 has five (5) functions, and Call Stack 4 has six (6) functions. Therefore, we can calculate the total permutations by multiplying the number of functions in each call stack. In this case, we find 900 (5x6x5x6) possible “Function Chains” or “functional variations” represented by these call stacks.
Again, a “Function Chain” is defined as a unique sequence of functions that implement the behavior. For that reason, our original functional variation of kernel32!OpenProcess -> kernel32!VirtualAllocEx -> kernel32!WriteProcessMemory -> kernel32!CreateRemoteThread is one example, while a hypothetical Function Chain might be kernel32!OpenProcess -> kernelbase!VirtualAllocEx -> ntdll!NtWriteVirtualMemory -> ntdll!NtCreateThreadEx would be a second variation. From the attacker’s perspective, these two variations are interchangeable because they produce the same result. From the detection engineer’s perspective, these small functional changes might cause the sample to evade detection. Below I’ve included the four Function Call Stacks with no function highlighting (no red circles) to show examples of how this works.
Let’s look at some of the different Function Chains these Call Stacks represent.
Standard Win32 API Functions
The most likely Function Chain is the one that uses the documented Win32 API functions. These are the functions that Microsoft intends for developers to use when writing software, so they are often consistent across versions of the OS, well documented, and easy to find tutorials on. For that reason, it is prevalent for malware also to use these functions unless there is a specific evasion consideration that causes the developer to use the less known functions that are lower in the stack.
Syscalls Only
A second alternative that has become more popular over the past few years is skipping past the higher-level API functions to make direct system calls (syscalls). Malware developers use syscalls because, in some cases, EDR sensors use logging techniques that allow them only to see high-level user-mode function calls. Malware developers can evade this subset of sensors or events by making calls directly to syscalls.
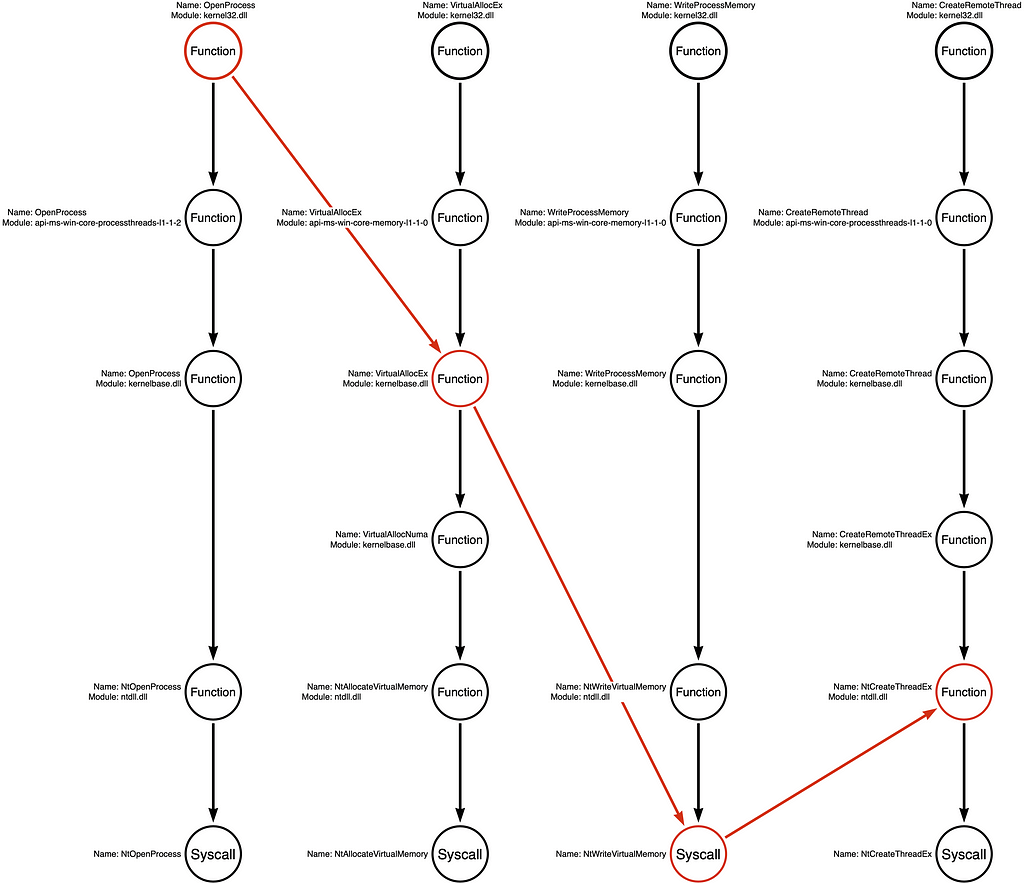
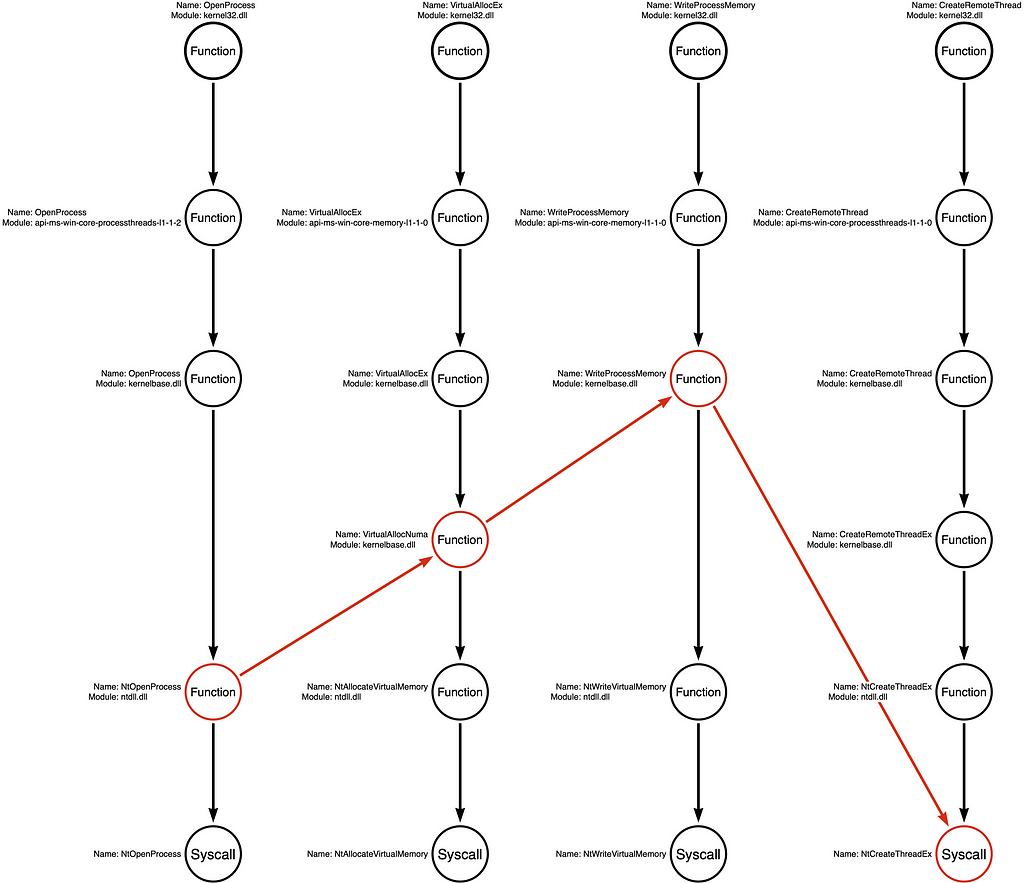
Arbitrary Example Variations
While the first two examples represent some of the Function Chains most likely to be selected, we can derive MANY other Function Chains from these call stacks without first observing them in a “real” sample. Below are two examples of arbitrary function chains that developers could use to create an alternative tool that would be functionally equivalent to the original but may be different enough to evade some detection rules.
Operation Chain (Procedure)
We have identified 900 possible Function Chains that malware developers can use to implement this “Classic Remote Thread Shellcode Injection” variation. While changing the Function Chain may be enough to evade some telemetry generation or detection rules, most of the Function Chains described by the existing graph are so similar that their differences are irrelevant from a detection engineering perspective. Put another way, “these functional variations are fungible from the attacker’s perspective, and often fungible from the defender’s perspective.” This is because most modern EDR sensors generate telemetry from the kernel, and therefore, the capture mechanism is at the bottom of the Function Call Stack.
If a developer can use any function in the Call Stack to replace any other function in the Call Stack, then it makes sense that the detection engineer would want to view the collection of functions within a Call Stack as if they are the same. This is the basis of abstraction, the idea that although kernel32!OpenProcess and ntdll!NtOpenProcess are literally different functions; they are similar enough to treat them as the same. This allows the detection engineer to ignore irrelevant differences between Function Chains and focuses their energy on dealing with the differences that matter. Using this logic, we can derive an abstract category that represents or can replace any interchangeable function in a Call Stack. For example, instead of making those fine-grain distinctions between the functions mentioned earlier, we can refer to them using the Process Open operation. For a deeper look into this “Operation” idea, see Part 2 of the On Detection series.
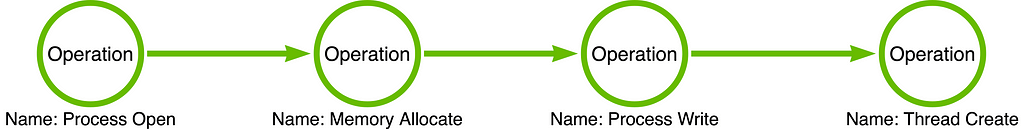
I have added an Operation Chain to the graphic below. We have converted the specific Function Chain of kernel32!OpenProcess -> kernel32!VirtualAllocEx -> kernel32!WriteProcessMemory -> kernel32!CreateRemoteThread to an Operation Chain of Process Open -> Memory Allocate -> Process Write -> Thread Create. This analysis has generalized the specific Function Chain used by the malware sample to an Operation Chain representing 900 Function Chain variations. Abstraction saves us from the necessity of making small/onerous distinctions.
Note: The circles and arrows that comprise the Operation Chain are green in the Tool Graph.
One of the arguments that I will make in a future post is that, for the most part, we do not see function calls (despite what certain EDR naming conventions might lead us to believe). Instead, we perceive something that more closely approximates the aggregation of the Call Stack, something I have previously referred to as an Operation. This operational focus is becoming more common as EDR sensor technology becomes more sophisticated. In general, EDR sensors now generate much of their telemetry in the kernel below the syscall, the bottom level of the (user-mode) Function Call Stack. That means that no matter which function in the stack a tool calls, the operation should be perceived by the EDR sensor. As a result, we can use the Operation Chain as an abstract summary of all 900 Function Chains in the Tool Graph. In other words, the Operation Chain allows us to ignore unnecessary complexity and align our conception with our perception.
Conclusion
The Tool Graph allows explicitly mapping a sample from the Function Chain to the Operation Chain via Function Call Stacks. This ultimately allows for comparing multiple samples at different levels of abstraction. First, samples are compared functionally via their Function Chains. If their Function Chains are the same, then it is safe to assume that their Operation Chains will also be the same. However, in cases where the Function Chains are not the same, the Tool Graph allows the samples to be compared operationally via their Operation Chains. This is the premise proposed in Part 7 of this series. The idea is that if two samples are “operationally equivalent,” then they will almost certainly be mutually detectable. However, if the two samples are dissimilar at the operational level, this analysis may have revealed an opportunity for evasion.
The cool aspect of the Operation Chain is that it provides a new level of abstraction. Operations do not literally exist. Instead, they are ways for us to categorize Function Chains so similar that tool developers can switch them out transparently.
It is important to remember that this is but one Operation Chain that the attacker can use to implement this behavior (Process Injection). This analysis aims to provide a concrete foundation for the layers of abstraction we are building. While my initial plan for this series included some prediction in discovering previously unknown variations, the first step should explicitly model KNOWN variations or tools. As a result, I recommend starting with a specific tool of interest. A tool provides a concrete foundation and helps to facilitate an onramp to this type of analysis. Your tool of interest may be an open-source tool (like I showed here), a tool in a threat report, or a component or command used by a C2 platform. The cool thing is that we will start to understand which differences and variations are more profound by analyzing many different tools. For instance, we might analyze two tools that claim to be significantly different. However, they are simply implementing two different Function Chains that can be summarized by the same Operation Chain (they are synonyms). Alternatively, we may see two tools that purport to be interchangeable from the operator’s perspective, but they implement two different Operation Chains. Over time, our model will grow, and we will have a more robust understanding of the changes attackers can make to fool our detection rules.
If you want to increase your analytical abilities, I recommend creating Tool Graphs for each sample in DGRonpa’s Process_Injection repository. This practice will help not only reinforce the skills that are necessary for building Tool Graphs but it will demonstrate the snowball effect of analysis. As you analyze multiple samples, especially samples that implement the same or similar techniques, you will continually encounter the same functions over and over. If you organize the results of your analysis well, you can save yourself a lot of time as you increase your experience with new and different samples.
On Detection: Tactical to Functional Series
- Understanding the Function Call Graph
- Part 1: Discovering API Function Usage through Source Code Review
- Part 2: Operations
- Part 3: Expanding the Function Call Graph
- Part 4: Compound Functions
- Part 5: Expanding the Operational Graph
- Part 6: What is a Procedure?
- Part 7: Synonyms
On Detection: From Tactical to Functional was originally published in Posts By SpecterOps Team Members on Medium, where people are continuing the conversation by highlighting and responding to this story.