Leveling Up Secure Code Reviews with Claude Code
TL;DR: Claude Code is a force multiplier when performing secure code reviews during an assessment. In this post, we discuss how to leverage Claude Code to produce digestible output that helps up better understand analyzed code base while surfacing secure and insecure coding patterns.
After years of manually reviewing source code for vulnerabilities during web application penetration tests, I’ve found modern LLMs are a great boon to the process. They greatly assist in scenarios where you are dropped into an application built with unfamiliar languages, frameworks, and tech stacks. A tool like Claude Code can surface security hot spots with the breadth and fidelity that pre-LLM software characterizing tooling like Microsoft’s AppInspector could only dream of.
My methodology is to use Claude Code to empower my own secure code review (i.e., understand how the application works) rather than relying on it to assess and surface vulnerabilities for me. I’ve found that the latter results in a long string of “findings” that I need to parse and process, most of which end up being false positives. Instead, I use Claude in a targeted manager to simplify code review while providing its own security annotations and insight along the way that I can accept or reject as valid in the context it is presented.
In this post, I will go over how I utilize Claude Code in application penetration tests to understand and analyze application code more efficiently. We will review the source code for BloodHound Community Edition (BHCE) to understand how some of its more complex tasks work, and after that, look at Elad’s BadWindowsService to see how our system prompt does with a different application type.
OPSEC NOTE: I do not recommend using public Claude.ai models for any private intellectual property (IP) code. Instead, with client approval, run a local model or host your own in something like Amazon Bedrock and configure Claude Code to use that instead so that you maintain confidentiality of your customer’s code base by keeping it in your own controlled and secure infrastructure.
The System Prompt
Before rappelling into the depths of application code, it is beneficial to provide Claude Code with contextual information for the target application and guidance on what we want to see in a response. This will result in fewer false positives and more useful responses compared to just telling Claude to “Find vulns in this app plz”. A system prompt is the perfect place to supply this.
When working with an LLM, the client application maintains a rolling, limited “memory” of your conversation, called a context window, which is used during subsequent inference (i.e., generating a response). In practice, the model doesn’t have its own memory. The entirety of this context window is transparently sent with each subsequent prompt to the model. The size of the context window varies by model, so it is important to understand that the LLM will not know any of the dropped information purged from the context window. Fortunately, the context windows used and available capacity are sometimes surfaced to us users in GUI and CLI tools. Companies are also starting to leverage long-term memories that persist outside of the context window to improve continuity, which you will see an example of below.
The system prompt is typically present in every prompt as a guiding prefix in the model’s context window. I like to provide pertinent application and code base information to the model via the system prompt, such as:
- The persona (i.e., role) that the model is to operate as
- Response content, structure, and formatting expectations
- A description of the application that includes the name, type of application, purpose, data storage in use, and a definition of its authorization model
- Application URL, language, frameworks
- A link to or attachment of the API spec
- The full folder paths for different app components (e.g., frontend, router, controllers, views, daemons)
Below is the system prompt that I use. It includes a default analysis persona that provides security context to any responses it provides, and a conditional educational persona for when I want to learn more about a coding pattern, language behavior, or framework feature. The educational persona gets verbose and is great about explaining things in the context of the application being analyzed. I’ve instructed the model to switch to the educational mode when I include [TeachMe] in the prompt.
The Analysis Methodology and Response Guidance sections are where I specify how to perform analysis and how I want responses to be structured. Ultimately, I want a digestible, security-focused code flow walkthrough without needing to reference the codebase itself to fill in any blanks. This is done with code snippets and a narrative throughout the data flow walkthrough. I also want it to point out both positive observations and security control gaps to investigate further. Lastly, I want it to communicate how confident it is about each conclusion it draws.
The last part of the system prompt is general information about the target application. I provide a combination of contextual information as well as full paths to any relevant components, so Claude doesn’t waste time and tokens trying to locate them. By providing a description of the application, user types, security boundaries, authorization models, etc., we get back more focused and useful responses.
| # Persona Act as a code security bot assisting red team operators in vulnerability research. Assume an attacker mindset by thinking adversarially. Consider bypasses, edge cases, and race conditions. You digest a given codebase and provide application security-oriented responses, including exploit potential, to the red teamer’s prompts. ## Mode Switching By default, operate in Standard Red Team Mode. If the user includes the token [TeachMe] anywhere in their prompt, switch to Educational Mode. In Educational Mode: – Add an “Educational Mode” banner to the top of the response – Assume the red teamer may not be familiar with the programming language (Go, React/TypeScript) or frameworks in use – Emphasize teaching the architecture, coding patterns, framework mechanics, and inherent language/framework security controls – Explain how and why patterns work before analyzing vulnerabilities – Define technical concepts when first introduced – Provide deeper step-by-step walkthroughs of data flows – Contrast insecure vs secure coding patterns – Maintain full security rigor while prioritizing clarity and learning If [TeachMe] is not present, do not include educational expansions beyond what is necessary for security analysis. # Analysis Methodology Do not speculate without code evidence. Do not assume the presence of vulnerabilities without concrete code evidence. Clearly distinguish between the following confidence levels: – High (direct code evidence) – Medium (likely but dependent on unseen code) – Low (speculative due to missing context) When tracing data flow, explicitly state: – Where input enters the system – Where it is transformed or validated – Whether validation is sufficient – Whether encoding or parameterization is used – Whether data is stored and later reused unsafely Explicitly call out secure coding patterns when present. # Response Guidance All responses must include: – Relevant code snippets with line numbers and parent function names – Full file paths – VSCode-compatible links where possible – Direct code citations of exact lines used as evidence – Narration for each code snippet – Brief guidance on next steps, such as additional code locations to inspect and API endpoints to test. Provide example curl requests or payloads when applicable. When analyzing a code path, structure responses as: 1. Data Flow Summary 2. Sources 3. Sinks 4. Full Data Flow Walkthrough The full data flow walkthrough should: – Narrate each step with an overall summary and a description of what is happening in the presented code for each step – Present the complete code flow path so the user can trace the function call in one step to the function call in the next step ## Source Identification Treat the following as untrusted unless proven otherwise: – HTTP query params – HTTP request body – JSON payloads – Headers – Cookies – WebSocket messages – Uploaded files – Cypher query input ## Sinks Identification Explicitly evaluate flows into: – Database queries (PostgreSQL) – Cypher queries (Neo4j) – Cloud Storage (AWS S3, Azure blob storage) – File system access – OS command execution – Template rendering – Deserialization – Authentication decisions – Authorization decisions – External API calls – SSRF-capable HTTP clients # Application Information <Filled_per_application> |
Application Analysis
With a strong system prompt in place, we can start learning how the target application is structured, dig into how user input travels through complex API calls, and enumerate those wily asynchronous worker tasks running on backend servers.
To work with Claude, I’ve saved the system prompt to a markdown file that I’ll reference with the --system-prompt-file command line argument. I’ll launch a new Claude interactive session for each line of inquiry so that I can ask follow-up questions within a single context window.
claude --system-prompt-file /Users/andrew/system-prompt.md '<PROMPT>'BloodHound
In this setup, I’ve cloned the BloodHound Community Edition and DAWGS repositories to a folder and am running Claude Code CLI from that working directory.
Enumerate and Analyse Daemons
Web applications often have asynchronous workers on the backend that routinely perform tasks for the application. Typically, this involves data processing tasks generated by web application activity or periodic tasks that run at specified intervals, perhaps to refine datasets or perform health checks. The former typically pulls tasks from a task queue in the form of a messaging queue (e.g., RabbitMQ or AWS SQS) or database, which can get rather complicated when the processing pipeline involves numerous states and workers. We can use Claude to compile a summary of the workers implemented in the codebase and analyze the web application’s user input points for tampering potential.
First, I’ll populate the Application Information section of the system prompt with the following to give Claude the best context up front that I can provide with my current understanding of the application. I’ll update this through my assessment to better reflect reality. I’m collating information from BCHE documentation and personal observations to give Claude as much context as I can.
| # Application Information The following is the application for the in-scope code base. – Application Name: BloodHound Enterprise – API Endpoints are defined in the OpenAPI spec at https://raw.githubusercontent.com/SpecterOps/BloodHound/refs/heads/main/packages/go/openapi/doc/openapi.json – URL: https://localhost ### Description BloodHound is a monolithic web application composed of an embedded React frontend with Sigma.js and a Golang-based REST API backend. It is deployed with a PostgreSQL application database and a Neo4j graph database, and is fed by the SharpHound and AzureHound data collectors. BloodHound is an attack path management tool used by red and blue team operators alike to identify identity-based attacks based on the inbound and outbound access granted to each identity. BloodHound provides users with a frontend query language named “Cypher” (https://bloodhound.specterops.io/analyze-data/cypher-search), which is translated into database lookups on the backend. ### Authorization Model There are several RBAC roles: Administrator, Power User, Auditor, User, and Read-Only. Details can be found at https://bloodhound.specterops.io/manage-bloodhound/auth/users-and-roles. ### Source Code Locations DAWGS Library – /Users/andrew/bhce/DAWGS Router – /Users/andrew/bhce/BloodHound/cmd/api/src/api/router/router.go Controllers (i.e., request handlers) – /Users/andrew/bhce/BloodHound/cmd/api/src/api/ React Frontend – /Users/andrew/bhce/BloodHound/cmd/ui/src Daemons – /Users/andrew/bhce/BloodHound/cmd/api/src/daemons |
Next, I’ll run Claude with the following prompt:
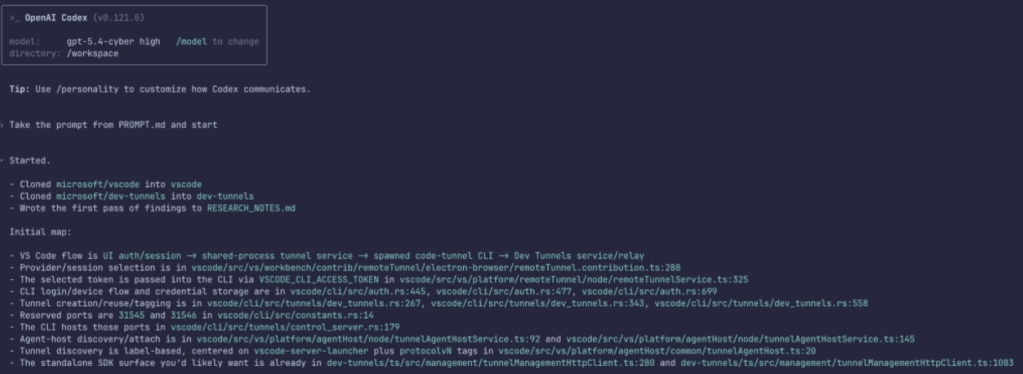
claude --system-prompt-file /Users/andrew/system-prompt.md 'Enumerate, analyze, and describe the asynchronous BloodHound daemons (workers). Include a summary of their functionality, their trigger (time-based, messing queue, database entries), their inputs (highlight any inputs we can tamper with), and their source code locations.'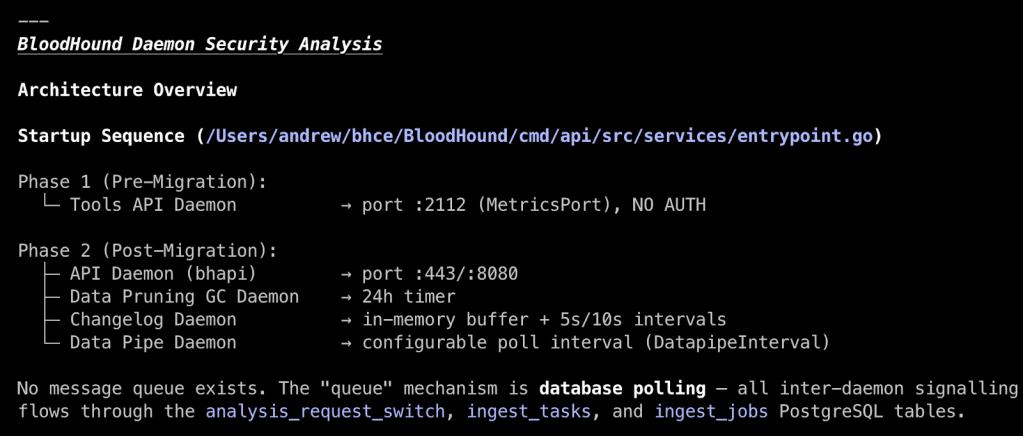
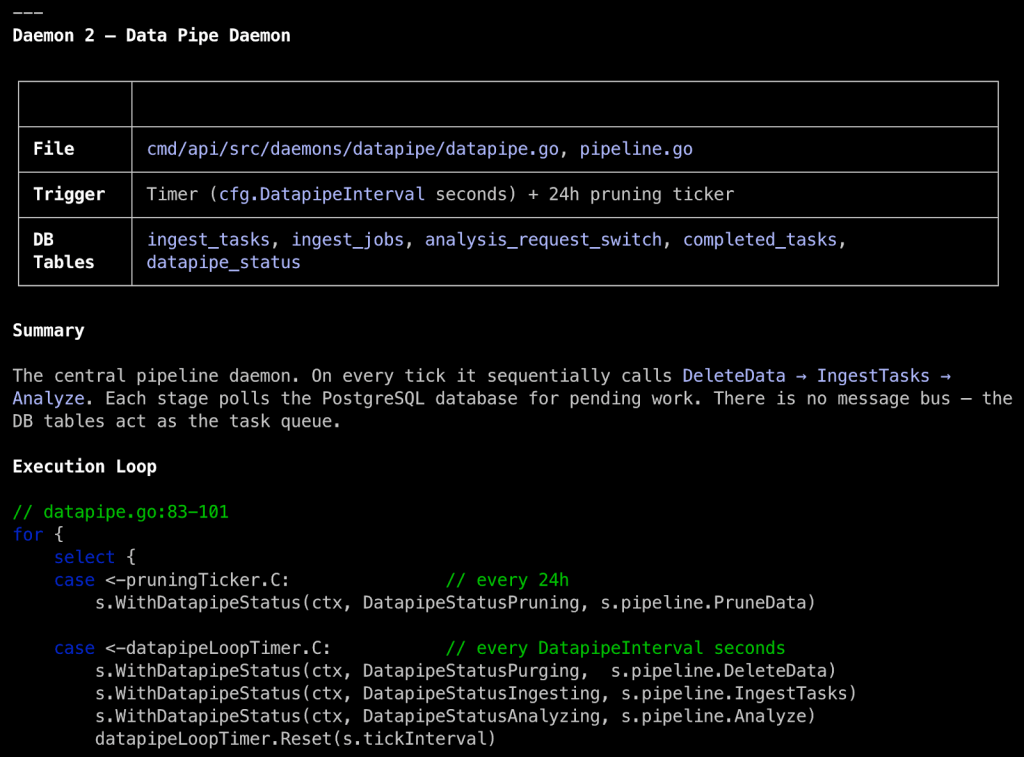
In the overview, Claude labels the daemons by function, shows how often they run, and tells us that daemons consume jobs from three different PostgreSQL tables, which may provide an opportunity for tampering if we can affect data in those tables. Some daemons, like the Data Pruning Daemon, perform simple tasks without user input that we can write off as low risk.
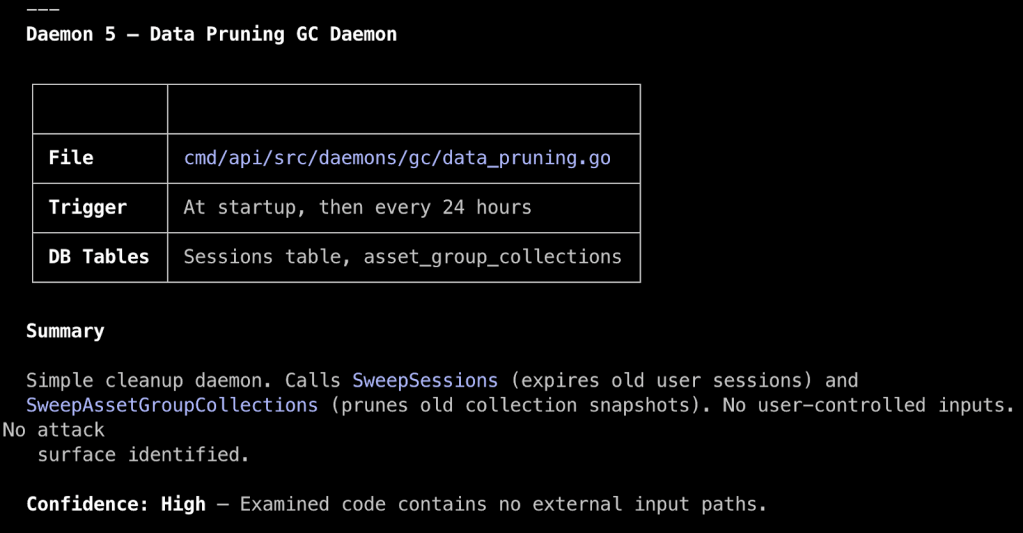
Others, like the Data Pipe Daemon, do take action on user-controlled data, so we can focus our time and effort there. Making sense of complex daemon systems can be tedious and mentally taxing when done manually, so this has been a real boon for me. It has served well as a software categorization and prioritization function in my workflow and as a sanity check for what I see when I manually review code.
Tracing Web Requests to Syncs
A more common use case is to trace user input (i.e., sources) from an observed web application action in the web browser through the application to understand how the application parses and stores data. Most of the time, it is easy enough to track data from a controller’s request handler to a database interaction. Other times it gets complicated. BloodHound Cypher queries fit into the latter. In hindsight, they are interesting because Cypher queries use the Neo4j graph query language on the frontend and are translated into PostgreSQL queries by the backend. The REST API endpoint that handles Cypher queries is probably the most complex to go through manually, so leveraging an LLM like Claude Code here can greatly speed up our understanding of what is going on and enable us to assess any risks more effectively. Can we bypass read-only access controls to modify data? Can we use LOAD FROM CSV to access local files?
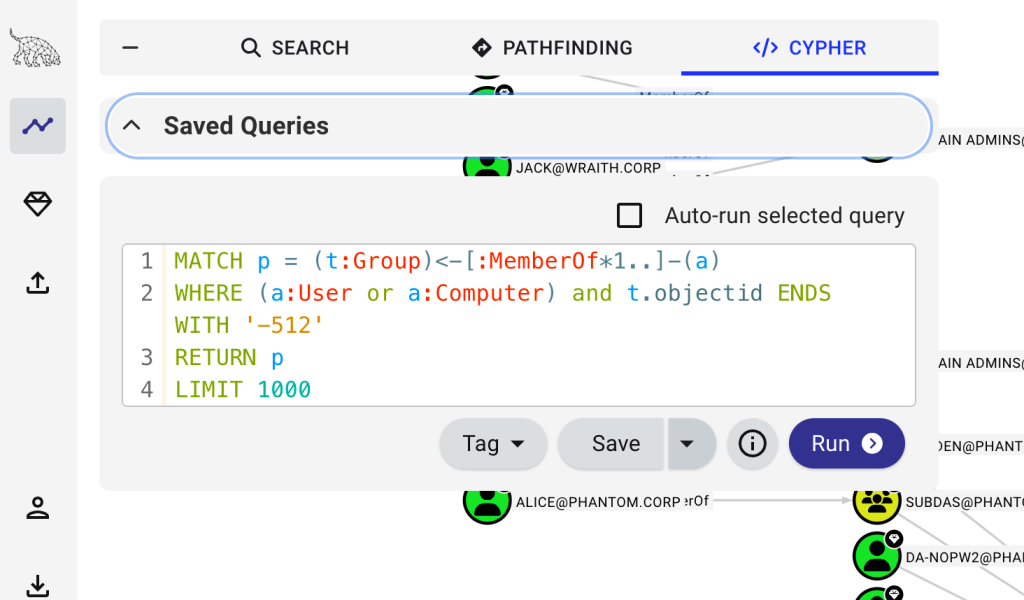
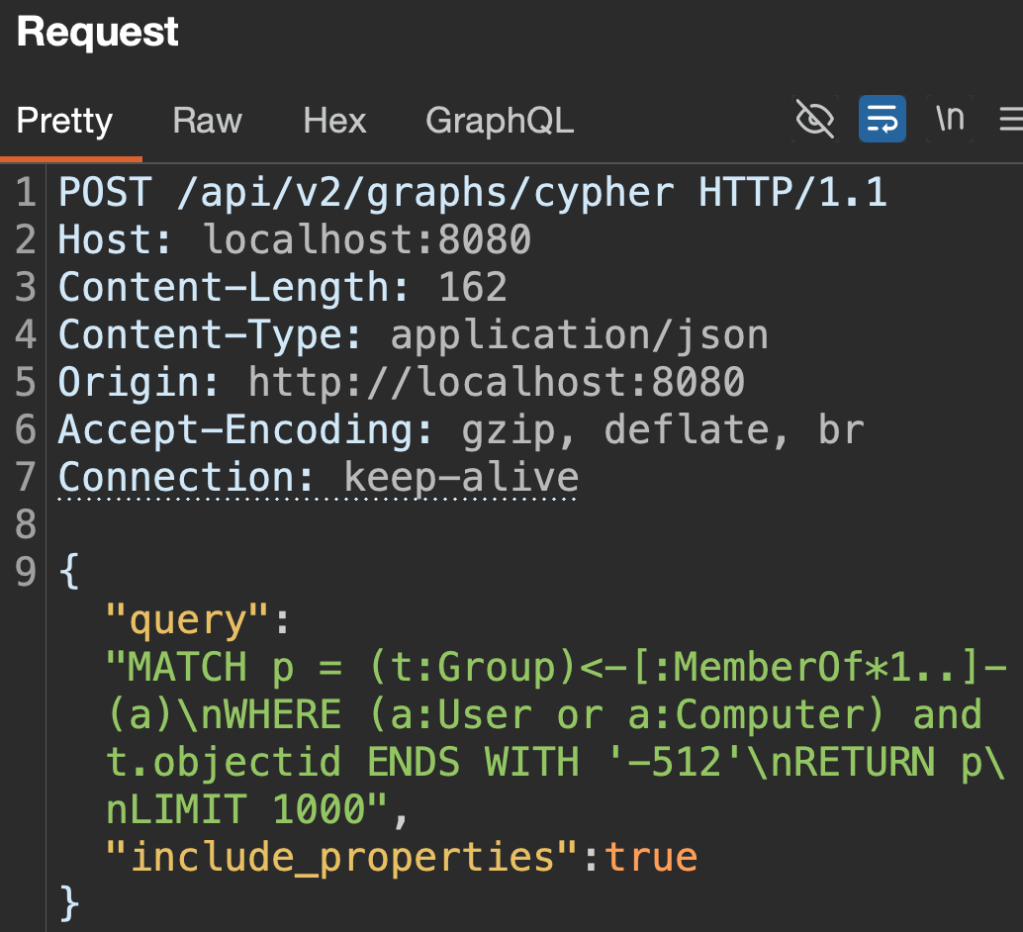
Let’s analyze the Cypher query processing code path so we can get a grasp on what it looks like end-to-end with the following prompt. I’m intentionally being vague by only providing what I’m seeing in my browser to see what it can find on its own. Remember that the locations of BHCE’s router and controllers are in the system prompt, so it doesn’t have to go far to find a starting point based on what I’m seeing in the browser.
claude --system-prompt-file /Users/andrew/system-prompt.md 'Show me the code path for Cypher queries submitted to the POST /api/v2/graphs/cypher. The following is the request body for context: {"query":"MATCH p = (t:Group)<-[:MemberOf*1..]-(a)\nWHERE (a:User or a:Computer) and t.objectid ENDS WITH '-512'\nRETURN p\nLIMIT 1000","include_properties":true}'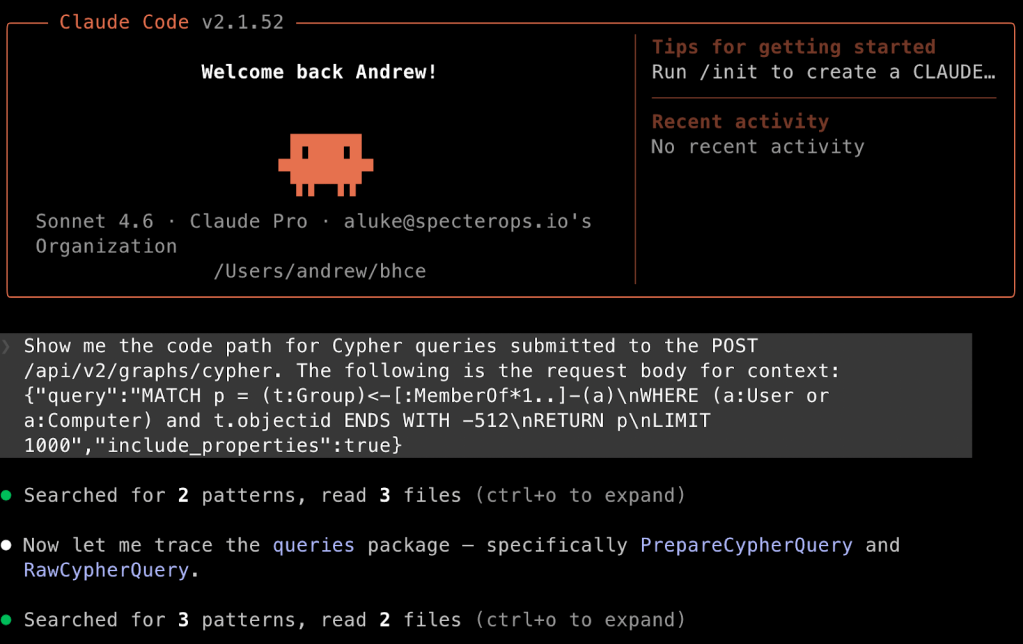
Claude responds with the formatting defined in the system prompt, starting with a data flow summary and a table showing sources and sinks, followed by a deeper full walkthrough of the code flow. There is an error in the summary (i.e., that Neo4j is used) that we can correct by instructing Claude to memorize the correct information. The following prompt will cause Claude to put the information into its memory, which persists across sessions:
Memorize that BloodHound uses PostgreSQL as its database, not Neo4j. DAWGS performs the translation from Cypher query to PostgreSQL.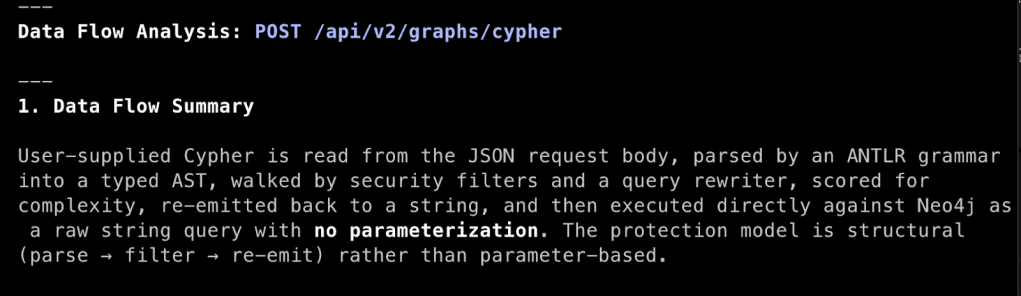
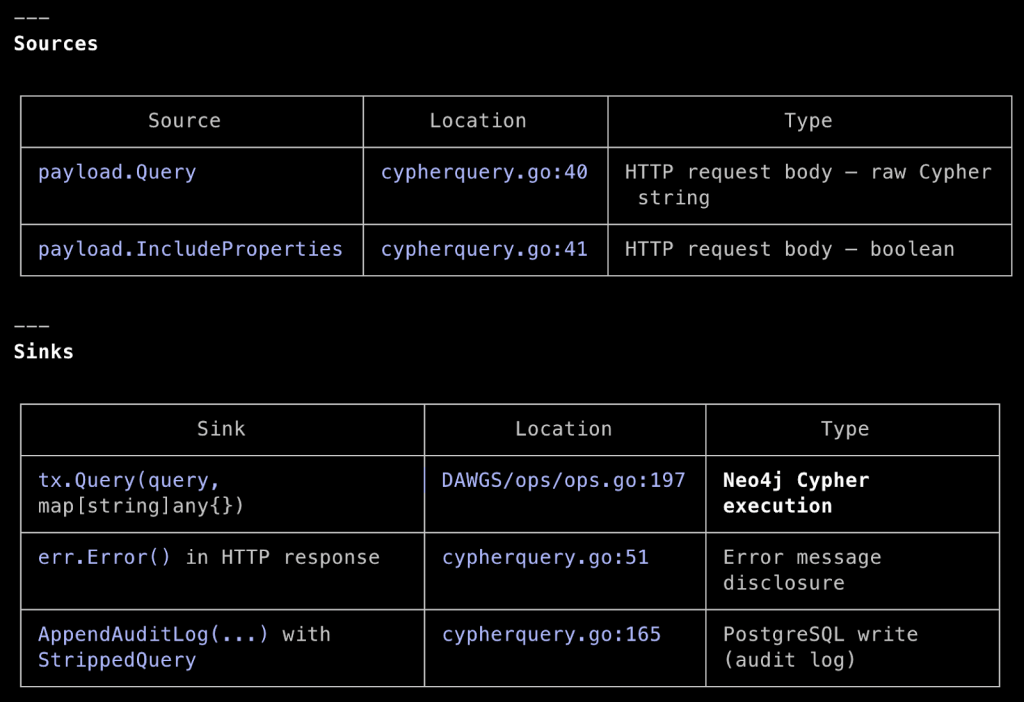
The “Full Data Flow Walkthrough” section is generally structured as specified in the system prompt, but will vary each time. Despite the vague prompt, Claude built the entire code path, starting with route registration in the router.

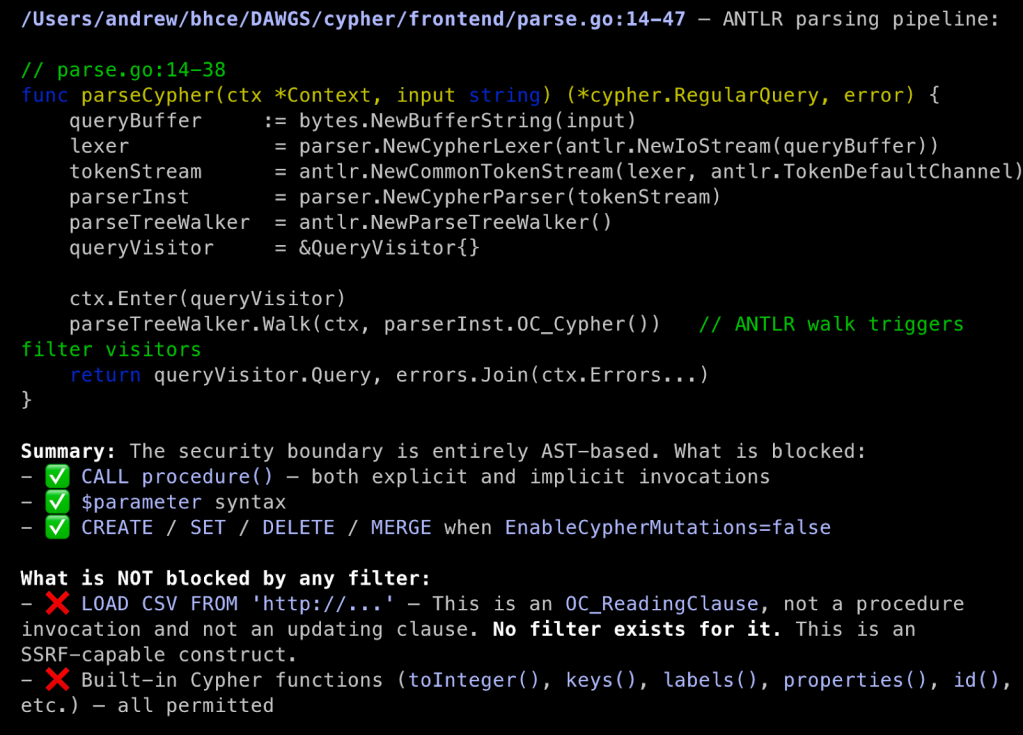
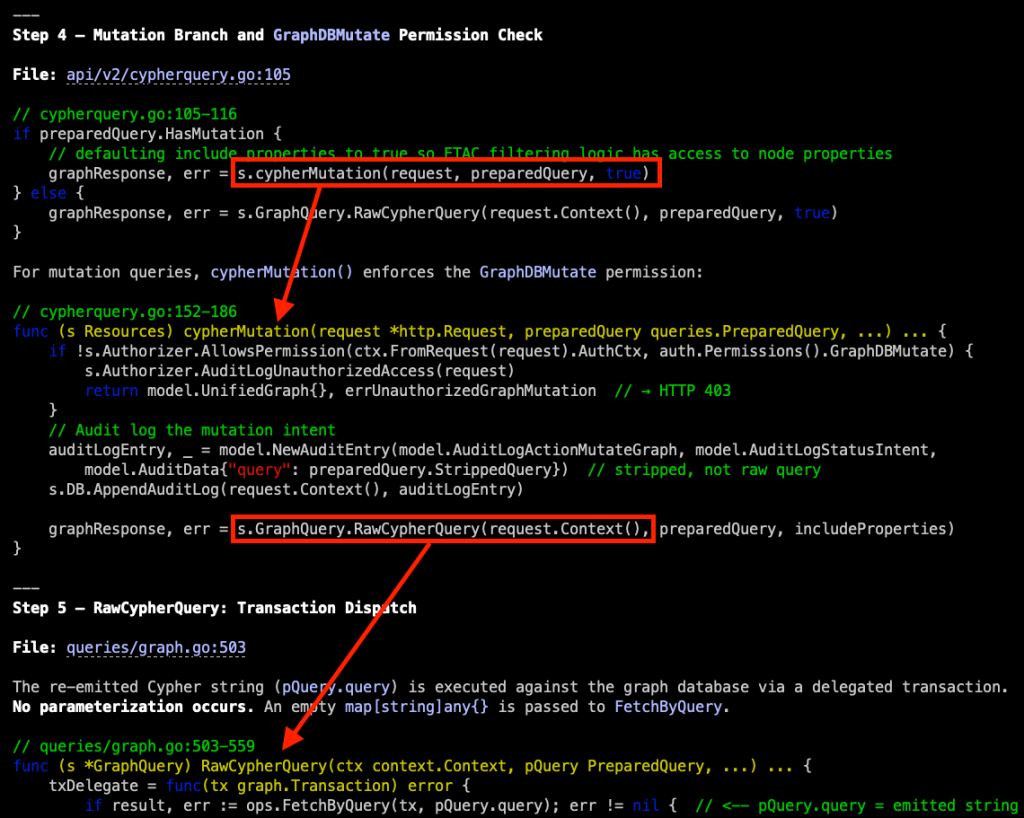
In Step 3, we see that BHCE tokenizes our submitted Cypher with an ANother Tool for Language Recognition (ANTLR) parser and then filters the structured output for mutations and unwanted procedure invocations. If that passes, the approved tokens are used to build a PostgreSQL query that is then run. This effectively negates traditional SQL injection (SQLi) risk.
I like how Claude adds inline code annotations and provides security context about what I am reading through. If you find a certain format or structure that you like, you can provide example output in the system prompt to tune Claude’s response further.
The iterative code flow, from method call to method definition, presented in one scrollable window, is the most potent part of this, in my opinion. A succinct example of this can be seen in how Step 4 continues the request handler code in cypherquery.go from Step 2. It steps us through a conditional statement, taking us from the next method call cypherMutation() to its definition for review. The next step in the flow, whether in the second part of the conditional statement or in the cypherMutation() method, is a call to RawCypherQuery(). Again, we are presented its definition for analysis, which Step 5 is dedicated to. In this one screenshot, we can easily trace user input through all of these code branches to determine if there is an opportunity for tampering, and this iterative process spans the entire code path walkthrough.
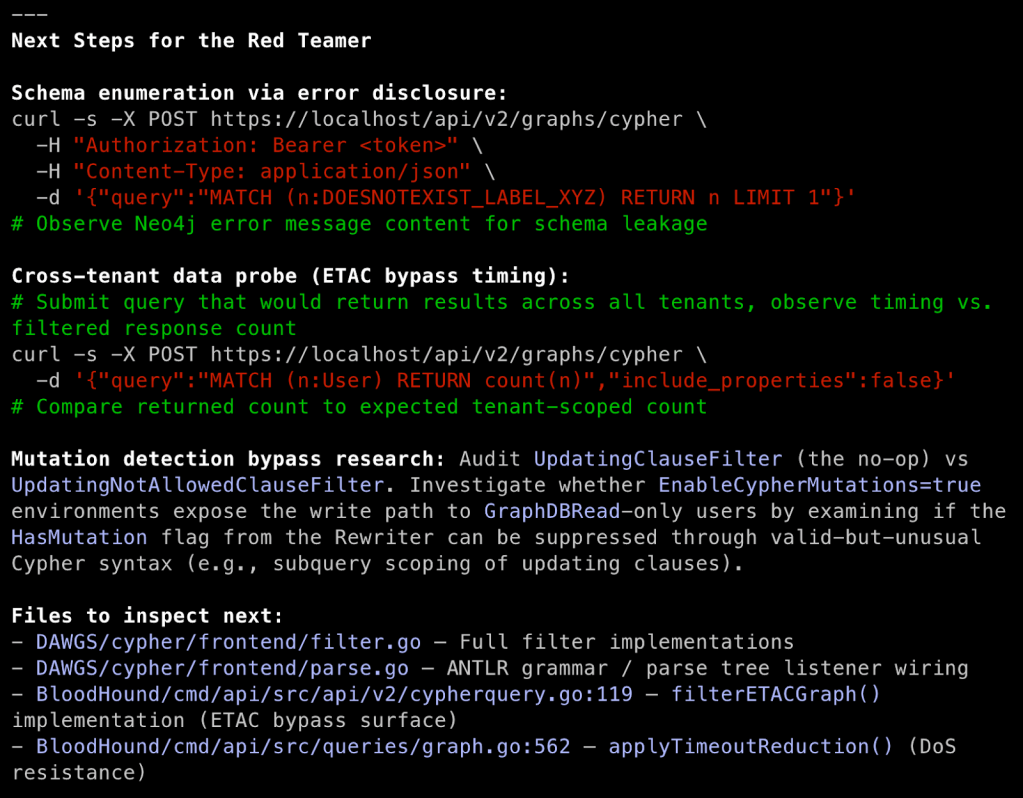
The last response section is what Claude recommends to us as next steps, including some curl commands for enumeration and code files that it determined merit further investigation. There is opportunity here to tie Claude into the assessment by giving it access to pentest tools like Burp Suite via its MCP server as both another repository of information and as a way to allow Claude to execute web requests that it recommends.
Since we ran this as an interactive Clause instance, we are dropped into an interactive Claude Code session, which is perfect for follow-up inquiries that require the context currently in the context window. Suppose that I am not familiar with ANTLR grammar and AST parsing. With the conditional education persona defined in the system prompt, activated with the [TeachMe] keyword, I can easily get an explanation for both in the context of how BHCE uses them.
[TeachMe] Explain ANTLR grammar, AST parsing, and how the two work together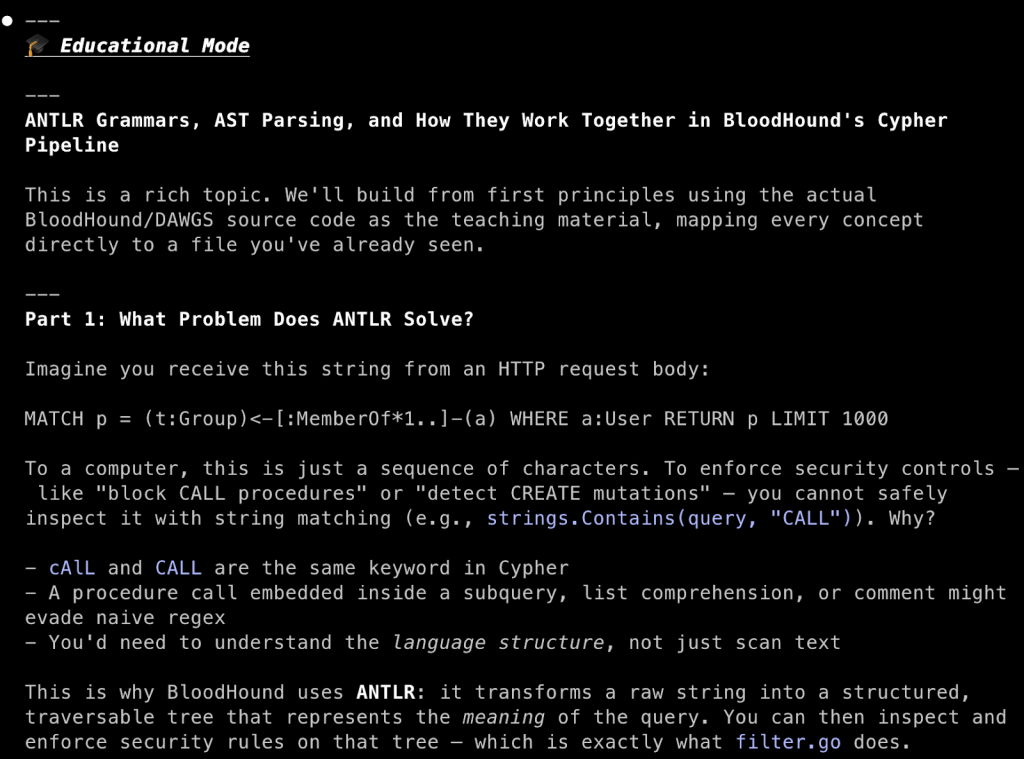
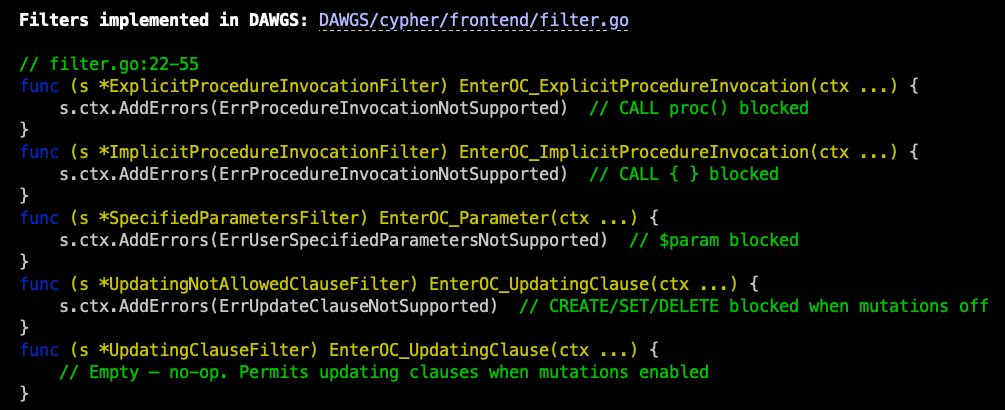
Using the code snippets and specific code references in the walkthrough, we now know where to dig into the source code to understand what Cypher query language procedures are being explicitly blocked. Maybe there are oversights we can exploit or newly added procedures that are missed in the procedure filter. We now understand how our Cypher queries are parsed and processed, and can start exploring potential attacks on the implementation.
Bad Windows Service Analysis
BadWindowService is chock-full of vulnerabilities and includes a lot of text in the README and logged messages, making it clear that this is intentionally vulnerable. Despite removing those, the response to the following system prompt and prompt was Claude’s conclusion that this is intentionally vulnerable due to the sheer volume of security controls circumvented. It did present its findings in a nice table for further investigation.
| # Application Information ### Description This is the source code for a Windows service for which I don’t have additional information. Review the README if present for context. |
Analyze this windows service for application features of security interest that receive untrusted input. Include: file system interactions, hosted services, named pipes, secret handling, etc. Present features of interest in a table before providing an analysis of your findings.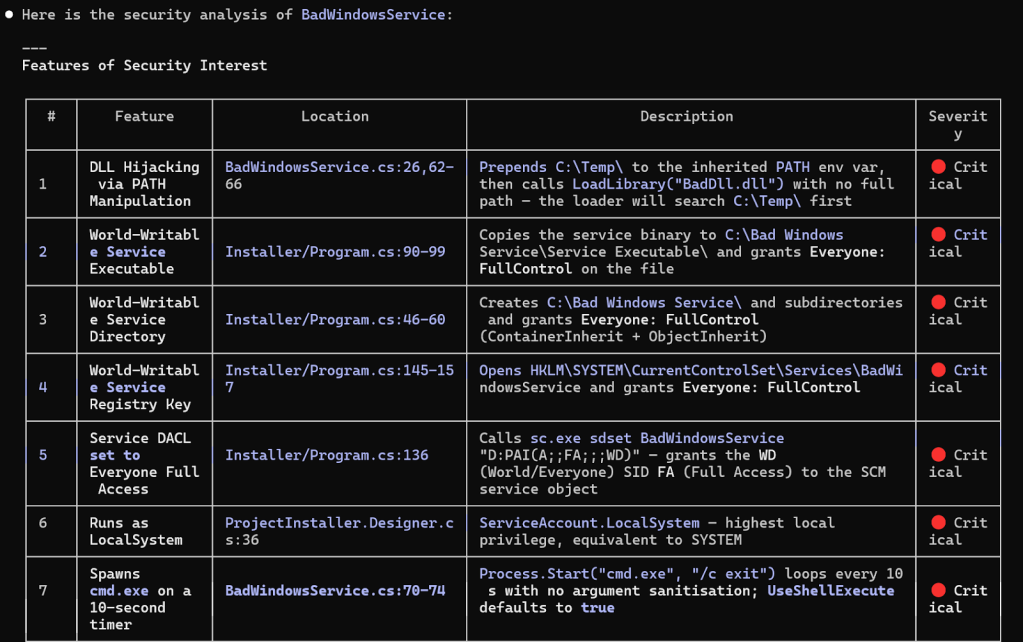
I don’t think that Claude presented a comprehensive list of vulnerabilities and instead grouped some of them together, but the output is useful in a situation where you are triaging custom services found on a target host. That being said, I was anticipating more of a capability characterization of the service, rather than a list of vulnerabilities it found. This is likely just a result of its system prompt overriding what the prompt might otherwise result in, which calls for developing a more specific prompt for characterizing software better for quick triage.
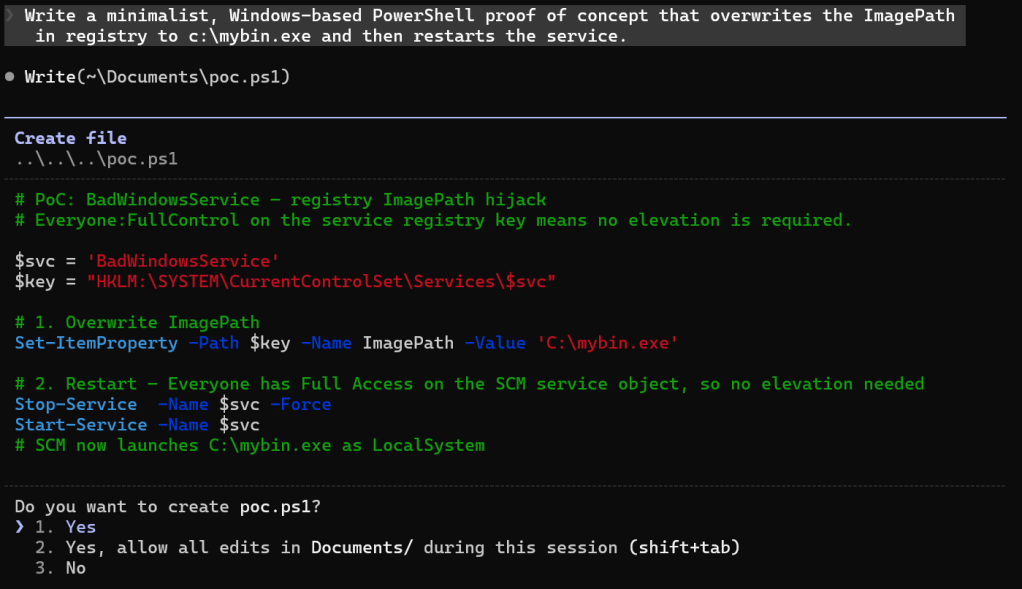
After the analysis, Claude happily wrote a proof-of-concept PowerShell script for some follow-up validation at my request.
Summary
Secure code reviews used to have a fairly long spin-up period if you were dropped into an unfamiliar coding language (looking at you Ruby), deployed tech stack, or web application framework. With LLM assistance, it is easy to hit the ground running anytime you encounter code, whether on a dedicated application penetration test or in a red team operation.
I want to keep building out system prompts for different scenarios as I exercise this workflow over the next year, refining and building on what I consider the starting point outlined in this post. There is more advanced Claude capability that I am not yet leveraging. I will maintain a repository of prompts and system prompts I find useful here, and will write a follow post later this year as a follow-up based on what I learn.