Spelunking through Splunk
TL;DR : Splunk is a daunting SIEM to learn, but this learning curve can be flattened by learning to use the basic building blocks which make up most Splunk searches.
A Detection Engineer’s Guide
When I first got my start in cybersecurity, Splunk was one of the most daunting platforms to use. The SIEM had an overwhelming amount of functions and patterns to learn. However, these same functions and patterns provide Splunk detection engineers with near-unrivaled versatility. When used properly, the platform is an exceptional asset for data exploration. This article aims to serve as a guide for future detection developers or analysts looking to start their Splunk-ing journey.
Search Efficiency
Queries (or searches) in Splunk each consume resources from a finite pool. Poorly written queries will consume outsized resources from that pool, and may or may not return the results you’re looking for. If enough inefficient searches are performed, it could impact the performance of all detections and searches.
To prevent any one user from bogging down the whole platform, most organizations configure Splunk to limit the resources any one user/group can consume. If you consume too many resources, Splunk will begin throttling your queries by putting your searches in a “queued” state. Inefficient searches take way longer to process and cause the SIEM to slow down your future searches.
If you want to be an efficient detection developer, write efficient queries.
Query Guidelines
The following guidelines can help keep your searches effective and efficient. These guidelines boil down to two basic principles:
- Limit amount of data Splunk needs to process
- Choose the best function for your search
DO: Use a filter on the index or sourcetype fields
The default index and sourcetype fields are special fields that you can (and should) use as filters to greatly increase the speed of a search. Each index in Splunk represents a specific set of data. Searches that use an index filter tell Splunk exactly what data set we’re interested in, substantially cutting down the amount of data Splunk has to sift through. Similarly, each sourcetype represents a specific data format in the index. When a search contains both an index and sourcetype filter, both the search’s speed and efficiency increase.
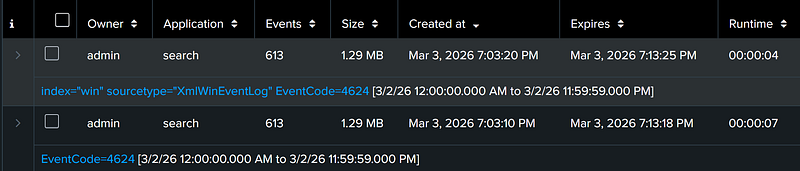
As an example, here is a job report for a search with and a search without index & sourcetype specified. The search with the index & sourcetype filter completed nearly twice as fast. If we investigate the resulting search jobs, we see Splunk used the index & sourcetype filters to dramatically reduce the number of data buckets (or data sets) it needed to search.

DO: Restrict the timeframe of the search to only what is necessary
One of the most intuitive ways to boost the speed of the search is to reduce the scope of the search timeframe. A search with a shorter timeframe will require Splunk to sift through less data and perform less tasks. Often, shortening the search timeframe will have the greatest impact on the speed of the search.
DO: 1. Filter – 2. Manipulate – 3. Format
As a general rule of thumb, searches should be structured as follows:
- Primary Search Filtering
- Result Manipulation
- Result Formatting
The primary search filters should include your index & sourcetype filters and your other field-value filters. Commands which manipulate each individual event (a.k.a., Streaming Commands – eval,regex,fields,etc.) should come after the primary search filters have removed as much irrelevant data as possible. Finally, commands which interact with the entire result dataset at once (such as Transforming Commands [i.e., stats & table] and Dataset Processing Commands [i.e., transaction, sort,& dedup]) should only be performed once the results are finalized.
As an example, below is a query that follows this pattern:
Splunk has a built-in search optimizer which will reorder search functions for best performance, but this optimizer can only do so much. Try to adhere to the “Filter, Manipulate, Format” structure.
DO: Use rare keywords in filters
As logs are being ingested, Splunk tokenizes the logs to create a Bloom Filter data structure. When a search filter with an uncommon keyword is used, Splunk uses this data structure to quickly eliminate whole buckets of data which do not contain the keyword. This filtering happens before Splunk even begins examining individual events, performing field extractions, and most other search operations.
DON’T: Use wildcards in search filters
Wildcards can dramatically reduce the performance of a search. Especially if the wildcards used as both the start and end of a search phrase (i.e., *keyword*). Wildcarded search filters force Splunk to consider a larger variety of possible combinations while identifying search matches.
DON’T: Use a function for the first time without reading the Splunk documentation
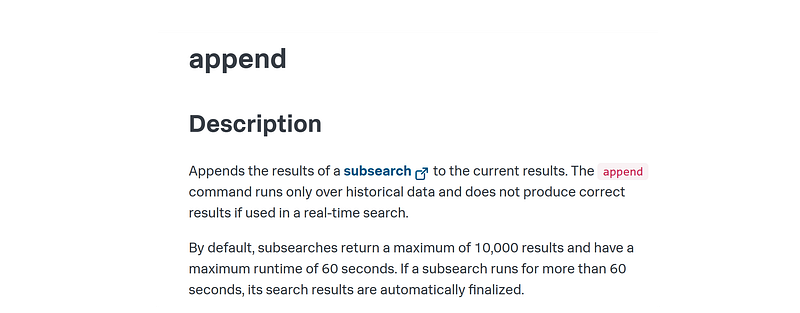
Splunk’s complexity is both a blessing and a curse. Many functions have hidden pitfalls. If you are at all unfamiliar with a function, Splunk provides useful documentation which details how functions work and any limitations the function has. As an example, the subsearch append command has default limitations which could negatively impact the reliability of a detection:
Splunk Building Blocks
Every Splunk search is built of the same building blocks. Below are the most common types of building blocks detection engineers should expect to encounter.
Basic Building Blocks (Signature Detections)
Field 1 is [X] (Field Search)
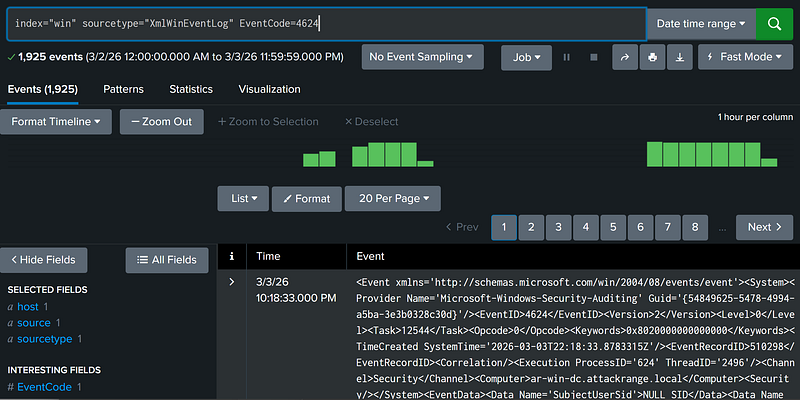
Field filters form the foundation of most Splunk queries. In the example above, our search filters for events where the field EventCode matches the characters 4624 (the Windows Security Log Event for successful authentication).
index="win" sourcetype="XmlWinEventLog" EventCode=4624 |
By default, the field name in the field filter is case sensitive. However, the value of the field filter is case insensitive.
```These filters are equivalent:``` |
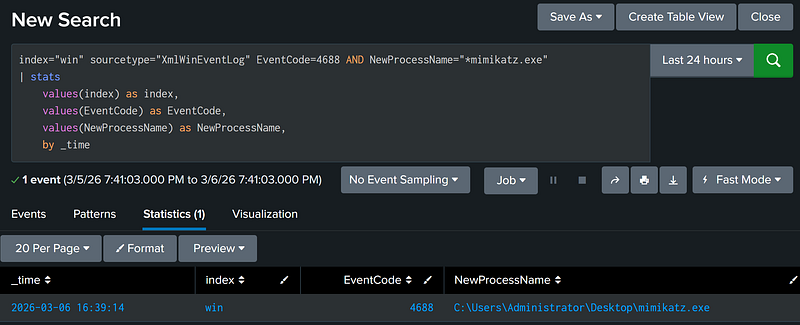
Field 1 is [X] AND Field 2 is [Y] (AND Operator)
The AND operator allows two or more conditions to be chained together. Events must meet both conditions in the AND, otherwise the event is filtered out. By default, Splunk chains search filters with an implicit AND so the AND operator does not explicitly need to be included:
```These two filters are identical:``` |
index="win" sourcetype="XmlWinEventLog" EventCode=4688 AND NewProcessName="*mimikatz.exe" |
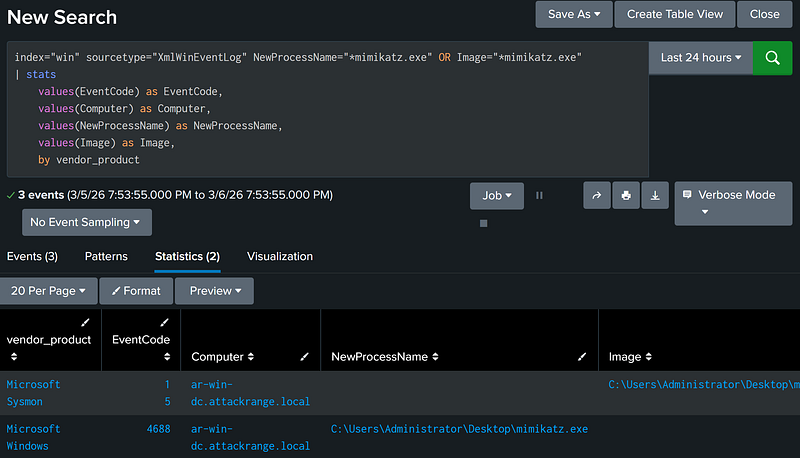
Field 1 is [X] OR Field 2 is [Y] (OR Operator)
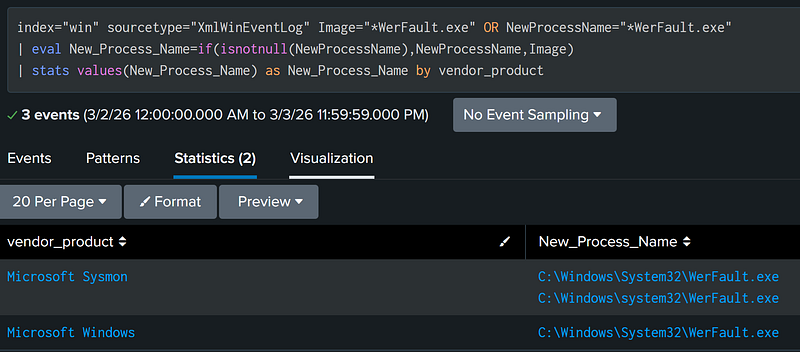
The OR operator can be used to chain one or more filters together. If an event meets any one of the conditions in the chain, Splunk passes the event down the pipeline. In our example above, we’ve used the OR operator to retrieve both Sysmon and Windows Event Log events in the same search.
index="win" sourcetype="XmlWinEventLog" NewProcessName="*mimikatz.exe" OR Image="*mimikatz.exe" |
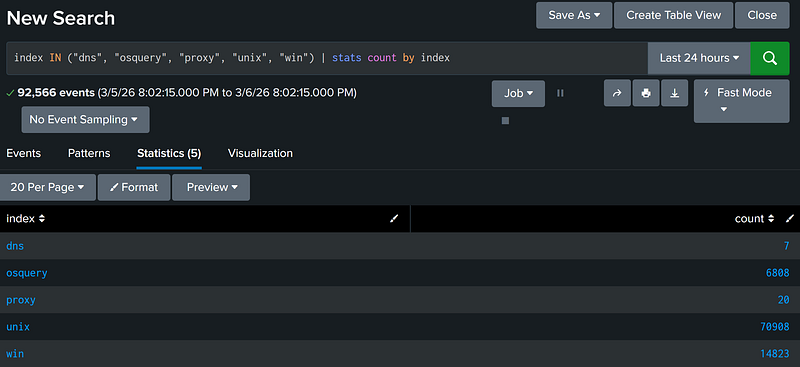
Field 1 is [X] OR [Y] OR [Z] (IN Function)
Writing multiple OR statements for a single field could get tedious (and looks ugly). Thankfully, the Splunk IN operator allows us to check if a field’s value is one of multiple values in a single operation. If the field contains any one of the values specified by IN, Splunk will return the field.
index IN ("dns", "osquery", "proxy", "unix", "win") |
```These two filters are equivalent:``` |
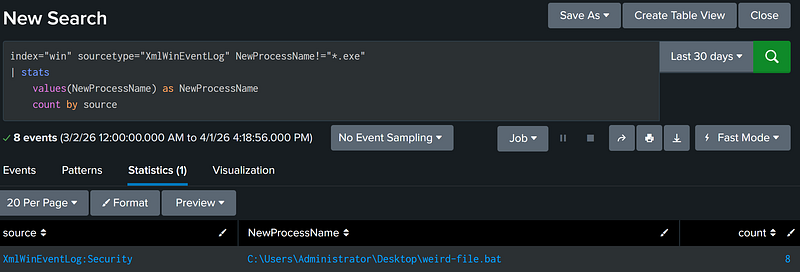
Field 1 is NOT [X] (!= Operator)
In Splunk, the != operator is used to denote a negation filter. This operator searches for when a field does not contain a specified value. This filter excludes events that do not contain the specified filter field.
index="win" sourcetype="XmlWinEventLog" NewProcessName!="*.exe" |
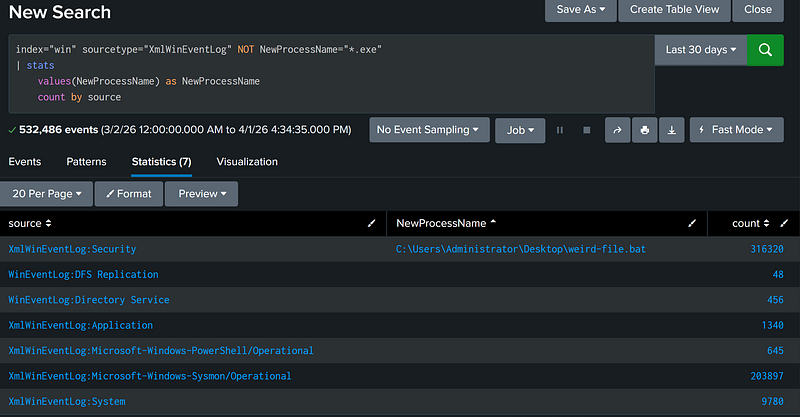
Field 1 Does Not Exist or is NOT [X] (NOT operator)
In addition to != operator, the NOT operator also denotes a negation. However, this filter has one key difference: if an event does not contain the filter field, the event is included in the results.
The example below serves to demonstrate how this behavior can impact a search.
index="win" sourcetype="XmlWinEventLog" NOT NewProcessName="*.exe" |
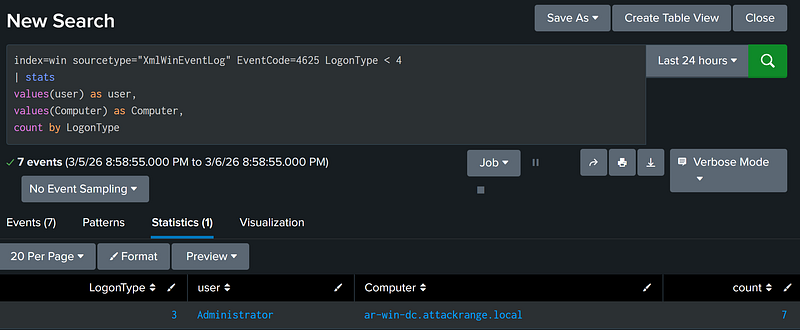
Field 1 is Less Than [X] (Comparison Operators)
Similar to most programming languages, the Splunk comparison operators are represented by the following operators:
# Filters for all events where field_1 is less than value_1 |
index=win sourcetype="XmlWinEventLog" EventCode=4625 LogonType < 4 |
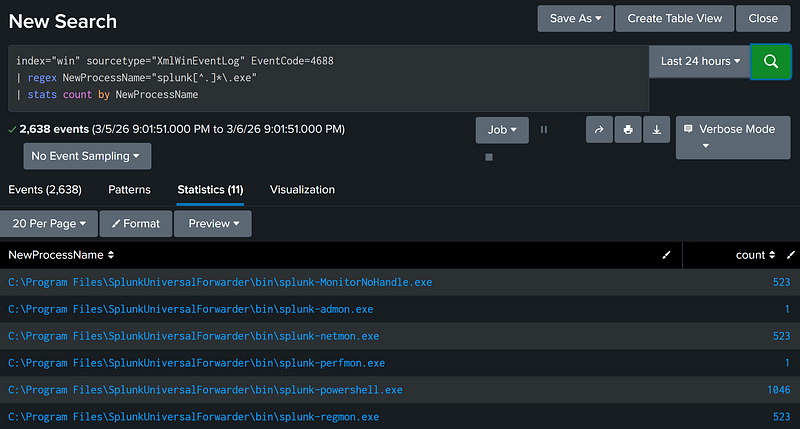
Field 1 Matches Regex Pattern [X] (Regex Matching)
Splunk supports using regex patterns as filters. This ability provides detection developers with a highly versatile method for focusing on specific patterns within specific fields.
In our example below, Windows process creation events are passed to the Splunk regex function, which is then used to filter specifically for executables that match standard Splunk executable naming conventions.
index="win" sourcetype="XmlWinEventLog" EventCode=4688 |
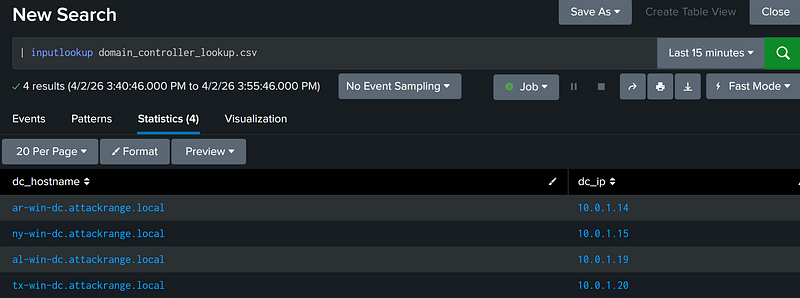
Field 1 of Value [X] Exists in Lookup Table [Y] (Inputlookup Subsearch)
Splunk supports the use of lookup tables for data enrichment. These tables are represented by a CSV or KMV/KML file and can be directly used as a filter in a search. This filter follows this pattern:
[ inputlookup [LOOKUP_FILE].csv |
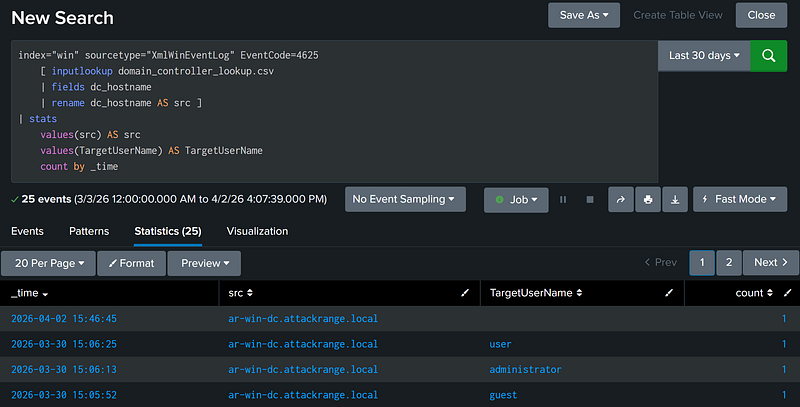
We’ll use the example below to break down how this search pattern works. In our example, we’re searching for Windows failed authentication events that occur only on domain controllers recorded in the domain_controller_lookup.csv lookup.
index="win" sourcetype="XmlWinEventLog" EventCode=4625 |
To start, the pattern opens a subsearch, the logic of which is defined inside the square brackets. When a subsearch returns results, those results are used as a filter for the outer, primary search. Inputlookup, The first function within the subsearch injects the full contents of the domain_controller_lookup.csv lookup into the subsearch with each CSV row as a separate result:
Because the src field only contains hostnames, the subsearch extracts only the dc_hostname field from the results using the fields function.
Finally, to apply the dc_hostname field as a filter to the outer search, the field dc_hostname is renamed to src.
As a warning, Splunk subsearches have a default timeout restriction of 60 seconds and will only return a maximum of between 10,000 and 50,000 results (depending on the maxout setting). Large lookups may blow past these restrictions.
index="win" sourcetype="XmlWinEventLog" EventCode=4625 |
Statistical Building Blocks (Anomaly Detections)
Statistical aggregations are useful for detecting an anomalous quantity of events. Splunk provides these aggregations under the stats command. The examples below are some common uses of these statistical aggregations.
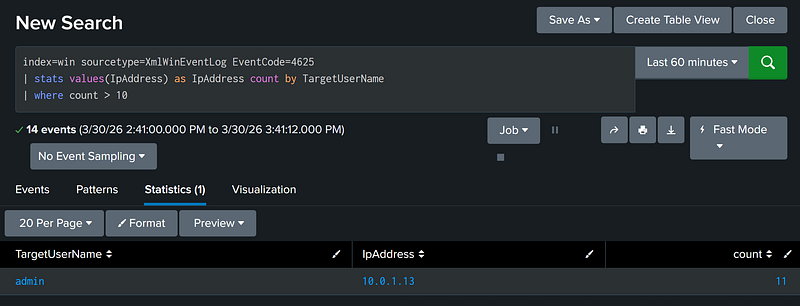
At Least Count [X] of Event 1 Over Search Timeframe (Stats Count By)
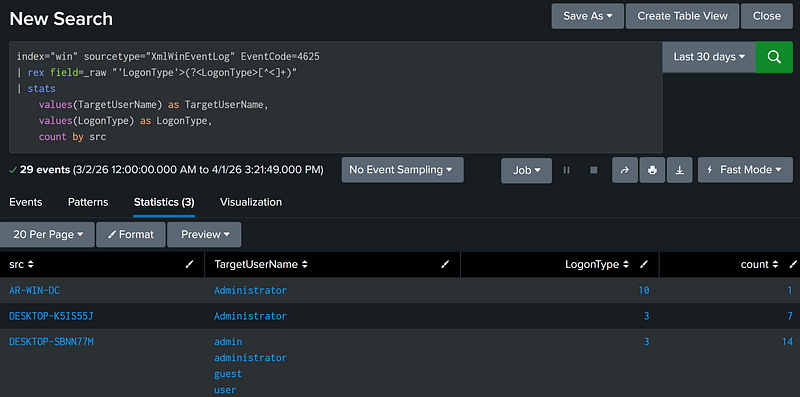
The most common usage of these aggregations is to get the total count of events per unique value of a selected field. In the example below, we group by the targeted username.
index=win sourcetype=XmlWinEventLog EventCode=4625 |
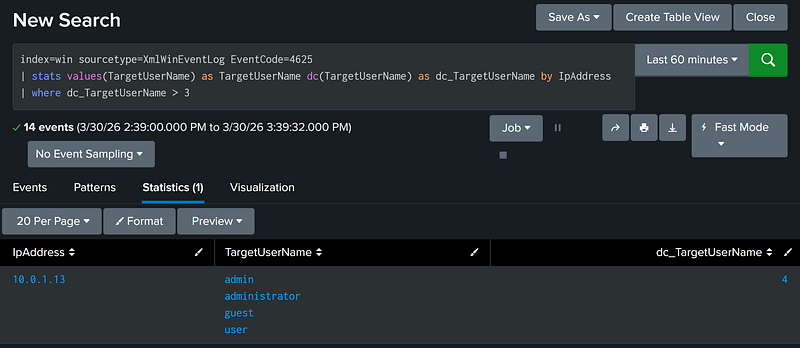
Field [X] in Event 1 has [Y] Unique Values over Search Timeframe (Stats Distinct Count Search)
The second most common usage of statistical aggregation is to get the total count of unique values in a given field for the aggregation. This can be accomplished with the stats dc (Distinct Count) function.
index=win sourcetype=XmlWinEventLog EventCode=4625 |
Advanced Building Blocks (Proximity-in-Time Detections)
Proximity-in-Time detections are exceptionally useful tools for detection developers. These types of detections typically monitor for two distinct, low-signal indicators to combine into a single, higher-fidelity or higher-severity detection. For example, inbound port sweeps are extremely low-signal Indicators-of-Compromise (IOC), as are successful RemoteInteractive authentication events. However, if we see a threat host sweep the network over port 3389, then observe a successful RemoteInteractive authentication to one of the hosts targeted by the sweep, this is a far better signal of a potential attack.
In Splunk, these detections have three steps:
- Introduce both indicators into the same search pipeline
- Create a new field to tag each indicator event with its respective label
- Performing correlations on those indicators
There are two different methods to introduce indicators into the same search pipeline: inline introduction and subsearch introduction. Additionally, there are two methods to perform correlations. One method uses bin to create time windows and stats, and the second method uses the transaction function. The either event introduction method can be used with either correlation method. Here are the use cases for each:
- Inline Introduction – Use when performing the correlation on raw events, or both indicators require a large datasets to be pulled in
- Subsearch Introduction – Use if some action is needed to create an event
- Bin/Stats Correlation – Use if the indicators involve large data sets
- Transaction Correlation – Use if the indicators involve small data sets or timing accuracy is critical to the detection
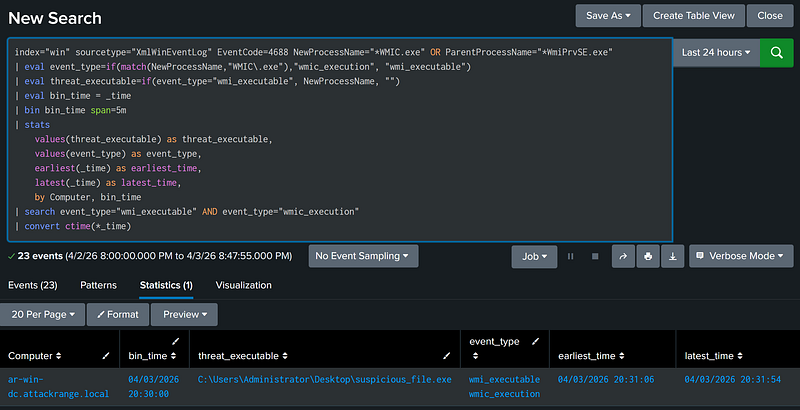
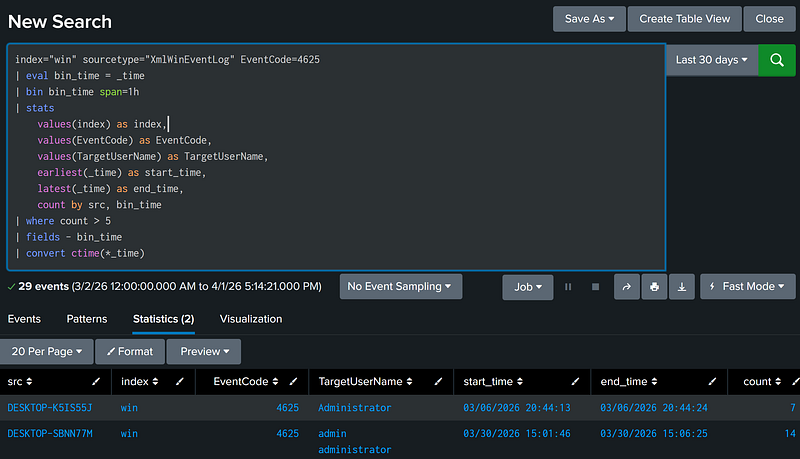
Event 1 and Event 2 are Observed within the Same [X] Minute Time Window (Event Tagging, Stats)
This following example uses an inline introduction with a bin/stats correlation. This search variant is the most performant combination.
Inline introduction is faster than using subsearch, and does not come with subsearch’s downsides (such as search timeout restrictions, result restrictions, and performance drawbacks). However, since both events exist in the same pipeline, functions which affect all events downstream will act on both events at the same time.
The bin/stats correlation works by aggregating events by distinct time windows. In the example below, results aggregate into five-minute chunks, then the search looks for both indicators in the same chunk. The bin/stats correlation also performs far better than transaction and does not come with the drawbacks of using transaction (poorer performance, event eviction, result restrictions, and timeout restrictions). However, this type comes with a built-in visibility gap. If indicator 1 occurs right at the end of a time window, and indicator 2 occurs right at the start of the next time window, the search will not notice the event. If the search’s accuracy is a strong priority, use transaction instead of bin/stats.
index="win" sourcetype="XmlWinEventLog" EventCode=4688 NewProcessName="*WMIC.exe" OR ParentProcessName="*WmiPrvSE.exe" |
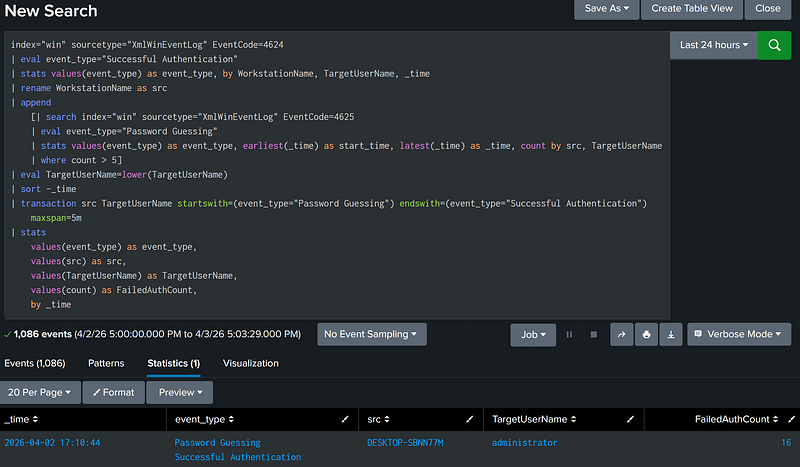
Where Event 1 Occurs [X] Minutes After Event 2 (Subsearch, Event Tagging, and Transaction)
This following example uses a subsearch indicator introduction with a transaction correlation. This search variant returns accurate results for small data sets.
Subsearch indicator introduction allows flexibility when it comes to data manipulation. In the example below, we use our subsearch to first filter for password guessing events before introducing the password guessing event into the outer search. Subsearches are also generally more readable, as distinct searches pull indicator 1 and indicator 2 into the pipeline. However, Subsearches have limitations and performance considerations. This function should not be used to return large data sets, and the function’s results are limited to 10,000 results by default.
The transaction function can be used to combine two indicators into a single event based on given fields. In our example below, if indicator 2 is followed by indicator 1 within five minutes, those two indicators are grouped into a single event. While this function does not come with the intrinsic blindspot that the bin/stats strategy has, it has a large performance cost and will evict events once it reaches certain memory constraints. Transactions should not be used to perform correlations on large data sets. Also be sure to note events must be sorted by reverse chronological order before the transaction command can be used.
```Event 1``` |
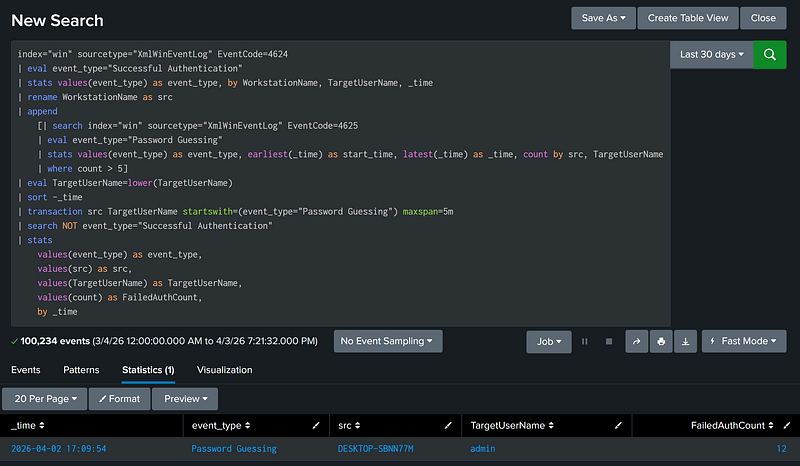
Where Event 1 is NOT followed by Event 2 within [X] minutes (Subsearch, Event Tagging, and Transaction)
Transaction aggregation can also be used to filter for events where indicator 1 is not followed by indicator 2. As transaction groups the two indicators into a single event, the search can be altered to filter for where indicator 1 exists without the presence of indicator 2. The example below is a search where password guessing is NOT followed by a successful authentication within the next five minutes (this could be used for a lower-severity password guessing alert).
```Event 1``` |
Field Manipulation Tools
These functions manipulate a field for every event passing through the function.
Populate Field [X] with Value [Y] (Eval)
The Splunk eval function is used to populate or overwrite a specific field for every event in a result set.
index="win" sourcetype="XmlWinEventLog" EventCode=4625 |

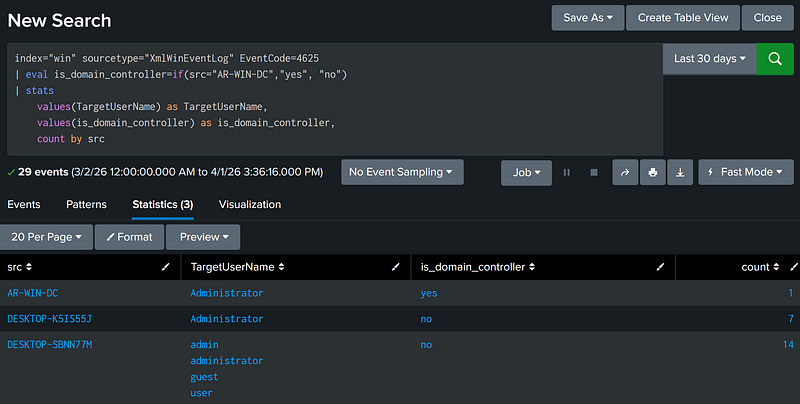
If Condition [U] is True, Populate Field [X] with Value [Y], Else With Value [Z] (Conditional Eval With If)
Splunk allows for dynamic field evaluation using the eval command with theiffunction. If the condition evaluates to true, the field is populated with the first value, otherwise the field is populated with the last value.
index="win" sourcetype="XmlWinEventLog" EventCode=4625 |
Populate Field [X] Using Regex Pattern [Y] (Rex Usage)
Some parts of the log may not be available as a field. However, Splunk provides the rex tool, which allows detection developers to extract fields using regex at search time, using regex named capture groups.
As an example, below is a failed authentication Windows Event Log (4625). The example search uses the LogonType named capture group to populate the LogonType field for every event that makes it through the initial filters.
<Event xmlns='http://schemas.microsoft.com/win/2004/08/events/event'><System><Provider Name='Microsoft-Windows-Security-Auditing' Guid='{54849625-5478-4994-a5ba-3e3b0328c30d}'/><EventID>4625</EventID><Version>0</Version><Level>0</Level><Task>12544</Task><Opcode>0</Opcode><Keywords>0x8010000000000000</Keywords><TimeCreated SystemTime='2026-03-30T15:06:13.3802667Z'/><EventRecordID>980292</EventRecordID><Correlation/><Execution ProcessID='608' ThreadID='3308'/><Channel>Security</Channel><Computer>ar-win-dc.attackrange.local</Computer><Security/></System><EventData><Data Name='SubjectUserSid'>NULL SID</Data><Data Name='SubjectUserName'>-</Data><Data Name='SubjectDomainName'>-</Data><Data Name='SubjectLogonId'>0x0</Data><Data Name='TargetUserSid'>NULL SID</Data><Data Name='TargetUserName'>administrator</Data><Data Name='TargetDomainName'>.</Data><Data Name='Status'>0xc000006d</Data><Data Name='FailureReason'>%%2313</Data><Data Name='SubStatus'>0xc000006a</Data><Data Name='LogonType'>3</Data><Data Name='LogonProcessName'>NtLmSsp </Data><Data Name='AuthenticationPackageName'>NTLM</Data><Data Name='WorkstationName'>DESKTOP-SBNN77M</Data><Data Name='TransmittedServices'>-</Data><Data Name='LmPackageName'>-</Data><Data Name='KeyLength'>0</Data><Data Name='ProcessId'>0x0</Data><Data Name='ProcessName'>-</Data><Data Name='IpAddress'>54.91.188.71</Data><Data Name='IpPort'>0</Data></EventData></Event> |
index="win" sourcetype="XmlWinEventLog" EventCode=4625 |
Tag Results with First and Last Event timestamp (Earliest, Latest)
You can use the stats function to enrich an event by calculating the start or end timestamp in the aggregation. This is done with the earliest or latest time modifiers.
index="win" sourcetype="XmlWinEventLog" EventCode=4625 |
Convert Epoch Time in Field [X] to Human-Readable Time
In Splunk, most timestamps are stored in Epoch time. To convert epoch timestamps to human-readable time, use the convert ctime function.
index="win" sourcetype="XmlWinEventLog" EventCode=4625 |
Useful Misc. Searches
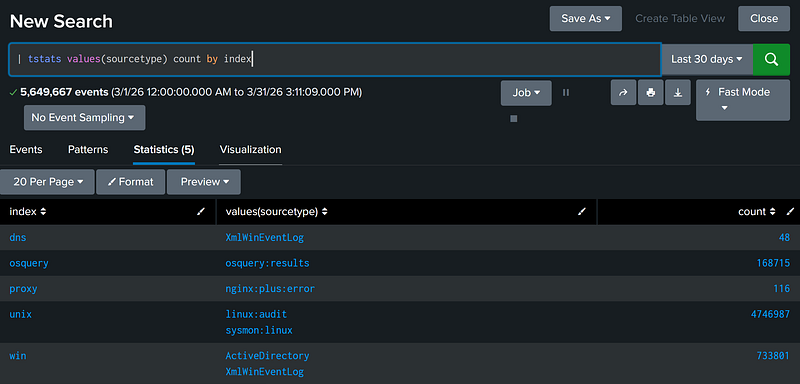
See all Sourcetypes by Index
The best way to understand available data in an environment is to understand the data types available. This search is crucial for getting a basic understanding of the data sources present in the environment.
| tstats values(sourcetype) by index |
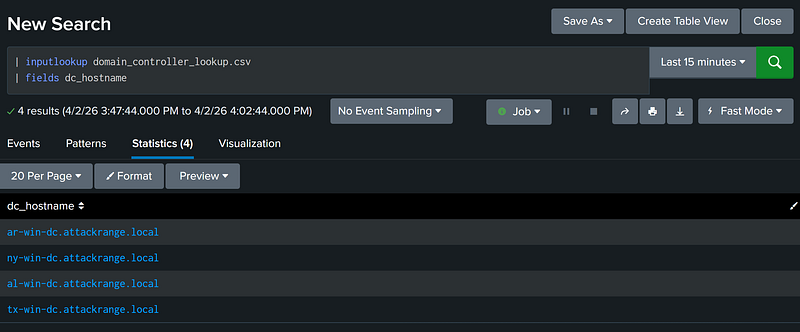
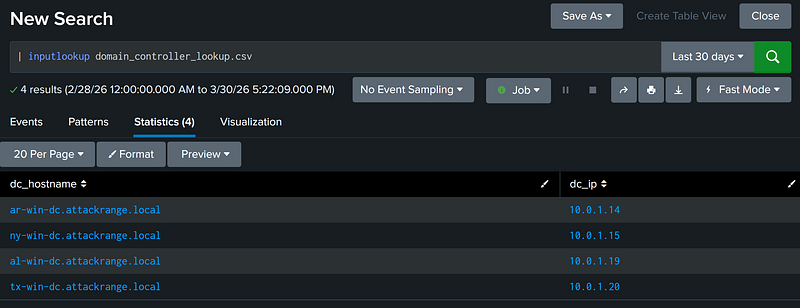
View Contents of Lookup [X]
The inputlookup command injects the contents of the targeted lookup directly into the search pipeline. This command can be used to enrich data, or perform searches.
| inputlookup domain_controller_lookup.csv |
Calculate Average Value of Field [X]
The stats command can calculate the average value of a field for a given aggregation. This is done using the avg command.
index="win" sourcetype="XmlWinEventLog" EventCode=4688 |
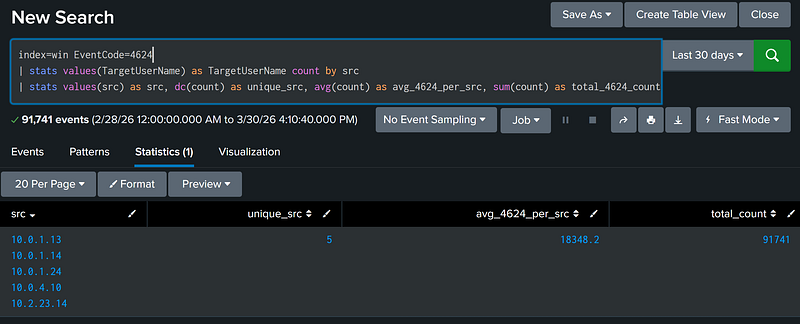
Calculate the Sum of All Values of Field [X]
The stats command can calculate the total sum of all values for a given field in an aggregation. This is done using the sum command.
index=win EventCode=4624 |
Building Blocks & Splunk
The basic building blocks provided above should give a solid foundation when constructing or evaluating a query. In the world of generative AI, having this foundation still serves an important role when determining whether a generated query is performing as expected. In the next blogpost in this series, we’ll cover how AI can be used to accelerate detection development, and the potential pitfalls I’ve observed in AI-driven detection engineering.