Finding SOCKS with Proxywatch
TL;DR: Adversaries use SOCKS proxy tunnels to pivot within environments and to execute code against compromised systems without bringing tools to the system. Defenders often lack reliable guidance to detect proxying behavior, falling back to preset rules based on static indicators or process-port baselines. This blog post highlights Proxywatch, a proof-of-concept release by SpecterOps, to detect SOCKS proxies and other pivoting methods through behavior-based detection.

Overview
When considering detections as a defender, it often helps to think from an attacker’s perspective and the choices they make (or are forced to make) in their tradecraft. The tactics, techniques, and procedures (TTPs) that attackers use are typically shaped by what actually works and change if effective security controls prevent or detect their previously working tools. As network perimeters harden and endpoint detection and response (EDR) tools improve, one technique that attackers use instead is the proxy pivot. After compromising a host, attackers use its presence inside of a network as an exit node, routing traffic from tools run on the attacker’s machine onto the victim network, often avoiding detection from EDR.
The SOCKS protocol describes a standard for network communication between a client and a server via an intermediary proxy server. Command and control (C2) tools like Cobalt Strike, Mythic, and Sliver all implement functionality to turn an agent (i.e., a compromised victim machine) into a SOCKS proxy. After enabling SOCKS, an attacker can use proxychains to run nearly any tool, even tools not designed to be proxy-aware, from the attacker machine and route its traffic through the compromised machine.
Once the proxy pivot is created and a connection is established, the actual proxying process works fairly simply. Let’s say an attacker uses Impacket to target a domain controller (DC), pivoting through a compromised host. The SOCKS proxy works as follows:
- A socket is created between the client (the attacker, using Impacket through proxychains) and the proxy (the victim machine)
- A socket is created between the proxy and the destination server (i.e., the DC) for the TCP ports Impacket needs
- Copy any bytes sent or received from one socket to the other. Since the TCP layer fundamentally works on ordered byte streams, the underlying traffic “just works” without independently of the IP layer
The SOCKS4a protocol extended the SOCKS4 protocol by allowing a client to specify a destination by domain name, rather than IP address, which is important for web servers with virtual hosts. The SOCKS5 protocol, which is not backwards compatible with SOCKS4, also permits connecting by domain name and supports IPv6, and adds support for authentication, commonly via username/password. Unlike a VPN, a SOCKS proxy does not need to rewrite traffic, so it can be created entirely in userland, without root or kernel-mode access. Its simplicity is a strength, making it a common feature for C2 frameworks or hacking tools.
However, proxying traffic in this way doesn’t require proprietary or malicious tooling. In fact, one of the most common tools to create a proxy for pivoting is with SSH with its port forwarding functionality. Other tools like plink wrap the port forwarding functionality of SSH into a single-purpose tool, but nearly any tool with the ability to point one socket at another, like socat can create a port forwarding tunnel. Developer tools like cloudflared or ngrok, meant to make local services available over the internet by traversing NAT, have seen increased use by adversary groups to enable backdoor access to a machine that normally would not be externally accessible.
Adversaries and Proxied Execution
MITRE ATT&CK lists examples where nation state adversaries have used proxied execution. In one example reported by Mandiant, an advance persistent threat (APT) group used custom tooling to force a target endpoint to establish a connection to an intermediary server via a unique HTTP header. This unique header indicated the beginning of the proxied connection and established a SOCKS5 TCP session.
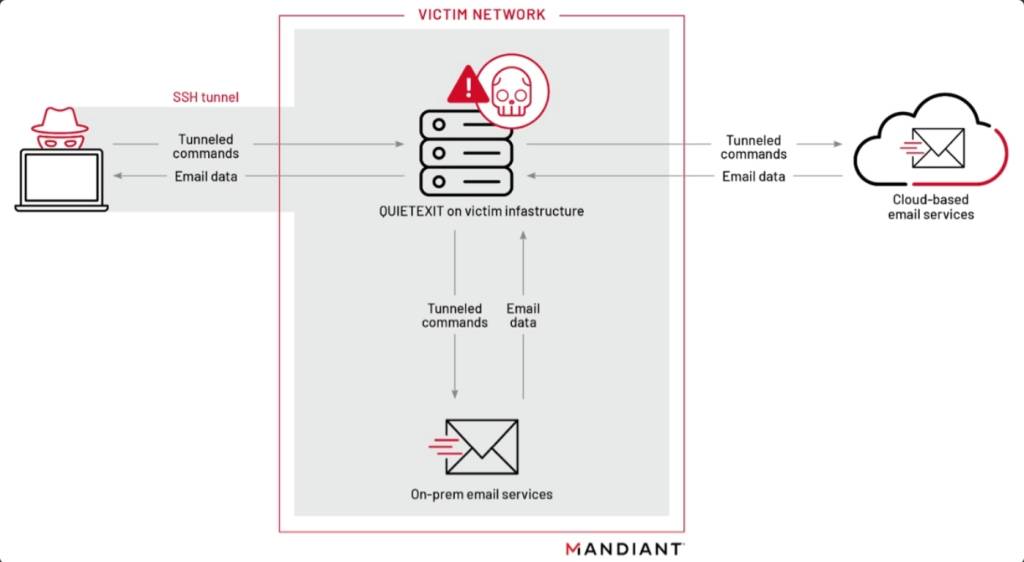
In another example, adversaries used SOCKS proxies to exfiltrate data from a victim’s cloud-based email services. By tunneling traffic to a compromised internal server, the connection between the victim’s cloud-based email services and the attack machine is masked by the intermediary server that already exists within the victim’s environment.
Not all adversaries develop their own tunnels and instead use open-source tools. For example, Sekoia reported an adversary group using a renamed version of the chisel project in an incident. Cybereason detailed the rise of Sliver, including SOCKS functionality, by threat groups. digital forensics and incident response (DFIR) Reports described a case where an adversary group installed Cloudflare Tunnels to enable RDP access to a server.
Red Teaming and Proxied Execution
C2 agents like Cobalt Strike’s Beacon usually have a set of baseline core features and the capability to load and run additional post-exploitation tools. Many C2 agents use a “fork-and-run” approach to this feature: to protect the Beacon against potentially buggy code and ensure it stays responsive if the loaded tool crashes, Cobalt Strike creates a new process, injects the code into that sacrificial process, and receives the tool output through a named pipe.
Many EDRs monitor process creation, including parent processes. Using data about processes and common child processes, EDRs build detections around unusual child processes, or correlate other data like network connections or file creations to parent-child processes. Detections built from this accrued baseline of process execution have made the fork-and-run model more likely to be caught. As red teams adapt to defenders, many choose to keep their code execution inline, i.e., executing within the implant process instead of spawning a child process.
Using proxied execution has the advantage of executing code on the attacker machine instead of on the compromised machine. The proxied execution simply connects to the open SOCKS port on the compromised machine and uses the compromised machine to connect to the attackers target for their objectives. The implant process doesn’t need to spawn child processes or load code, only act as the proxy for the attacker, potentially evading EDR detections built on parent-child process models. Many red teams see this model of using a lightweight core agent that acts as a proxy intermediary as optimal.
Purple Teaming and Proxied Execution
SpecterOps conducts purple team assessments for clientele with a depth approach to capabilities and versatility of technique execution. When executing a target technique, our overall goal is to objectively determine whether a client’s defensive solutions prevented the technique execution, alerted upon the technique execution, or if a specific alert did not fire – whether or not observable telemetry within the client’s data sources points to the execution of the technique. While we do not rank techniques by evasiveness (e.g., spawning a child process versus proxied execution), we find proxied execution remains elusive for many clients regardless of their choice of EDR. Typically, our recommendations for detecting proxied execution would focus on the technique itself, rather than identifying the use of SOCKS.
While conducting Purple Team assessments at SpecterOps, we try to steer clear of subjective terms like “stealthy” when describing the execution method versus the technique executed. This is due to the difference in the combinations of execution method and technique. Objectively, proxied execution has the most minimal disk presence: the attacker’s tools never touch the target system, and no new processes are introduced to execute post-exploitation code. However, if you combine proxied execution with credential dumping via OpenProcess to LSASS, the technique target will catch the proxied execution. This distinction is important to note when describing the offensive benefits and gaps of proxied execution.
A common scenario we see during Purple Team assessments is if an operator creates a registry run key persistence via Impacket’s reg.py through SOCKS, EDR solutions will miss the execution of code to create the persistence. This is due to the aforementioned benefit of proxied execution; the executed code remains on the attacker system and communicates over Layer 4 network protocols between the C2 and the target. However, if the defenders monitored the target of the technique execution (e.g., Registry Run Key Modification), then the technique would be detected because the registry was modified.
Our detection recommendations for proxied execution often worked for target interaction where the relative telemetry source was somewhat low noise. For high noise telemetry sources, predetermining the target of the technique often felt like guess work with varying results of accuracy (e.g., LDAP Searches). For example, SOCKS detections typically recommend looking for uncommon process-port pairs, such as processes communicating over port 88/TCP (Kerberos), port 389/TCP (LDAP), or port 135/TCP (Windows RPC endpoint mapper), but making and maintaining baselines of every process for every “interesting” port is cumbersome, tedious, and prone to overly broad exceptions.
Due to the lack of predictability for targets of proxied execution and a lack of industry tooling focused on proxied execution, we’ve created ProxyWatch.
Solution: ProxyWatch
ProxyWatch began as a hackathon project in Las Vegas trying to answer a simple question: how can we detect SOCKS tunnels? No tool existed that satisfied our criteria, so we created our own. Most detections we found either relied on inline network telemetry, such as from firewalls or intrusion prevention systems, or used post-hoc analysis, rather than live endpoint activity.
ProxyWatch started as a simple Golang program which flagged a handful of signals to assign a score to a process, and then assigned a “role” or label to that process. Three months later, ProxyWatch now incorporates roles to identify C2 sessions, SOCKS proxy pivots, and beaconing behavior by focusing on how processes behave rather than analyzing traffic.
ProxyWatch works by ingesting host and telemetry data from the endpoint it’s installed on. For each cycle at the desired interval, the telemetry collection captures network, user, and process context, then creates a snapshot. On Linux, ProxyWatch parses /proc/net/tcp, /proc/net/udp, /proc/net/raw, and /proc/net/packet, and maps sockets back to process IDs via /proc/<pid>/fd. On Windows, ProxyWatch collects TCP and UDP telemetry with Win32 API functions (e.g., GetExtendedTcpTable and GetExtendedUdpTable). For Windows processes, we use CreateToolhelp32Snapshot to obtain a snapshot. This gives us metadata including command line, user context, I/O activity, start time, executable path, and integrity level. Once enough telemetry has been collected, ProxyWatch builds a profile for each process through the scoring engine.
The Rule scoring engine currently has 83 behavioral signals, some of which are raw socket usage, loopback address usage, periodic callback cadence, measured jitter, writable paths, uncommon traffic destinations, named pipe C2 patterns, parent/child tunnel inheritance, and much more. The signals are combined and turned into a score, which will determine the role of a process. All of this lives inside proxywatch /internal/detection/behavior/* (beacon.go, session.go, pivot.go, listener.go, outbound.go, and distinguish.go). The role to signal maps (controlSignals, pivotSignals, outboundSignals, listenerSignals) and the signal to role inference are in proxywatch /internal/shared/roles.go.
Machine Learning
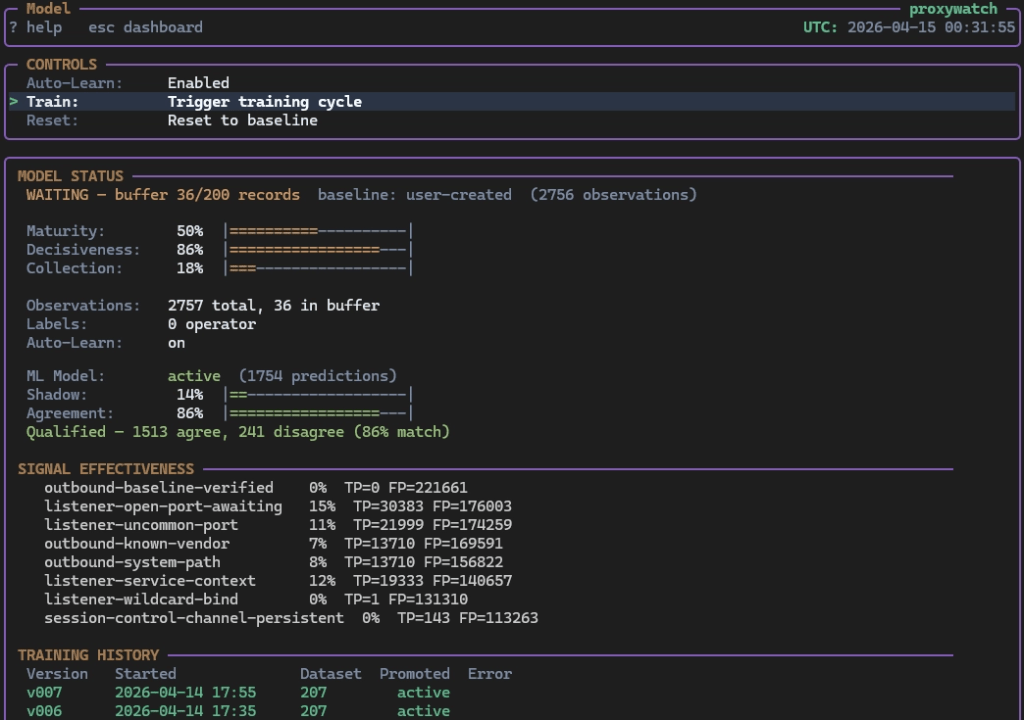
Along with the rules, ProxyWatch runs a local Machine Learning (ML) model that learns each cycle. The model reads 122 features per process and trains against the rule engine’s output. This allows the rules to act as the teacher and the model trains on itself, so it never drifts. It also runs in shadow mode while still learning and takes the lead on role assignment once agreement with the rules reaches qualification.
Having both matters because rules give ProxyWatch a baseline that works from day one, while ML catches signal combinations that the static rules cannot, working together they cover what either would miss alone. Below is the model dashboard, as this is where we can monitor the progress of the model, reset the baseline, or start and stop the ML engine.
Scalability
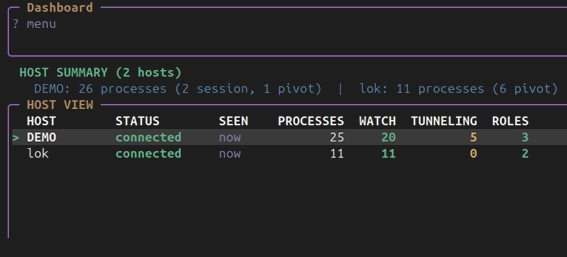
Currently, ProxyWatch can be used on Linux and Windows hosts as a standalone monitor or run as an ingest server and deploy agents throughout your environment. Some use cases include lab monitoring, quick triage, threat hunting, exploring egress routes, and more. When running ProxyWatch in Server mode and deploy ProxyWatch as an agent on each host, it runs the classifier locally and streams candidates to the ProxyWatch server over gRPC, where you can select which agent to manage by hostname as shown below.
AI-Assisted Development
Vibe coding is a part of ProxyWatch’s development. Speed is the obvious benefit, but there were challenges along the way.
Writing the right prompt can be tricky, too loose, and the output kind of works but misses the point. Too strict and the model builds X, Y, and Z exactly as described, whether or not that matches what you needed. What worked for us involved iterating on the prompt itself after reviewing the output and showing existing code patterns, stating constraints, and asking the model to describe its understanding before making edits.
Fixing one issue without creating another was an ongoing issue. While attempting to reduce false positives, we noticed ProxyWatch stopped detecting beacons. What helped was writing prompts that explicitly listed the detections, along with the signals applied and told the LLM that needed to keep the existing working detections while creating new ones that do not affect the current ones.
Repetitive code was another challenge. The LLM would create helpers and add abstraction where we didn’t need it. Helpers like hasSignal() got reinvented across several files before being pulled into one shared location. What helped was grepping for existing helpers before letting the model write a new one and treating cleanup as a routine step.
Vibe coding did not replace understanding the code; for us, it sped up work that is already well understood.
Tunneling Detection: Beacon SOCKS Tunnel
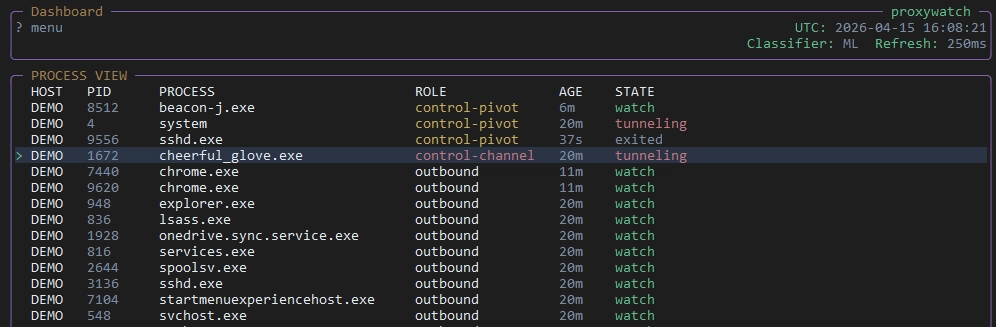
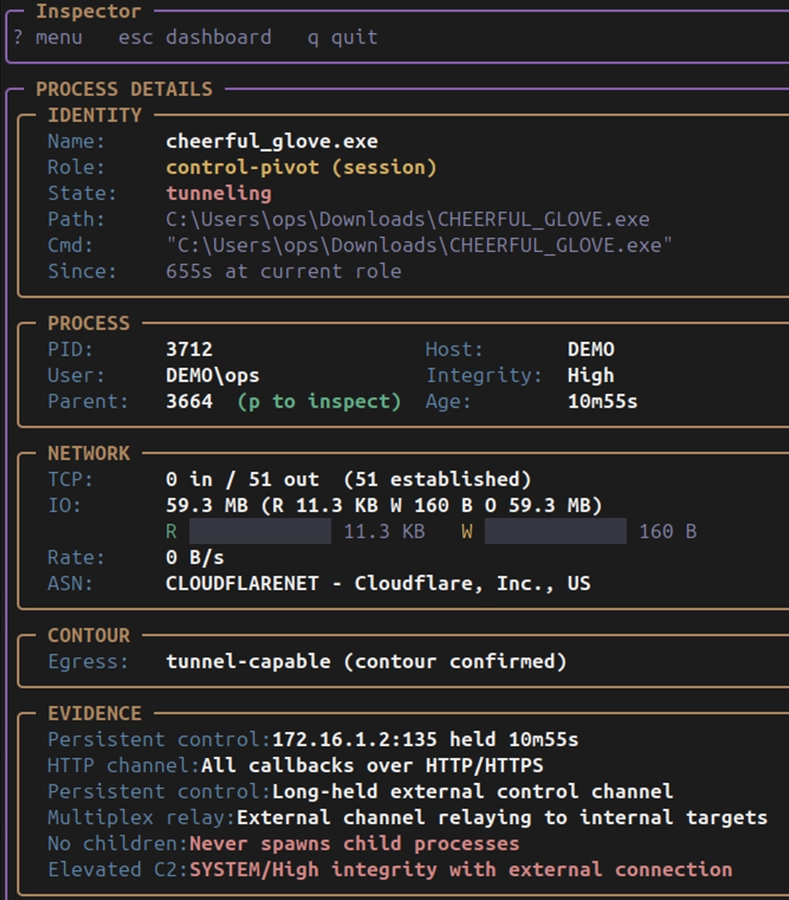
Below, we see a SOCKS tunnel started from a Sliver Beacon called cheerful_glove.exe. The activity shows a persistent control channel connecting to several ports on a single internal target. The process cheerful_glove.exe was assigned the control-pivot role. The signals that fired were pivot-multiplex-relay (external channel multiplexing to internal targets), pivot-non-loopback-internal (connections to internal addresses). The SOCKS tunnel was used with nmap for port scanning and netexec for SMB enumeration.
Control Channel Detection: Sliver C2 Beacon
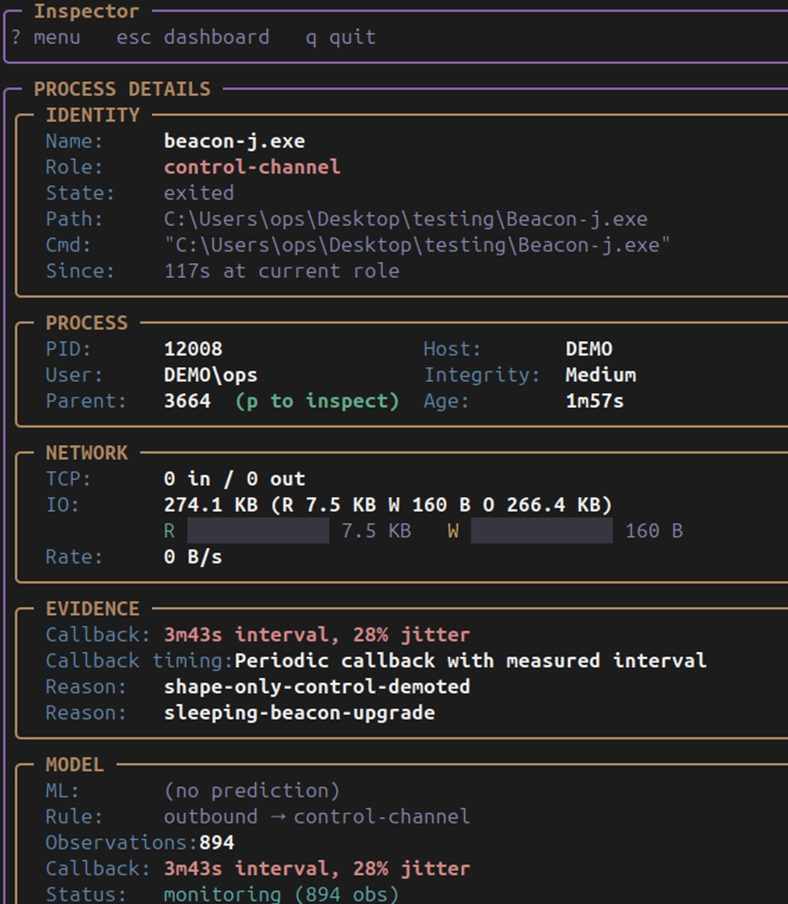
The process beacon-j.exe was assigned the control-channel role. ProxyWatch identified a 75-second callback pattern with a deviation/jitter of 0.44, with outgoing connections observed immediately after process spawn. The signals that fired were beacon-interval-confirmed (cadence persisted across sleeps), beacon-http-channel (all callbacks over hypertext transfer protocol secure [HTTPS]), and suspicious-exe-path (the binary ran from C:\Users\ops\Desktop\testing\). The binary was unsigned, not package-owned, and not located in a known vendor path, so the sleeping-beacon upgrade path engaged when the process went quiet between callbacks. A pending SYN_SENT connection showed attempts to reach a host that was likely offline or filtered. The process was, in fact, a Sliver beacon configured for a 60-second callback with jitter.
ProxyHound: BloodHound Collection
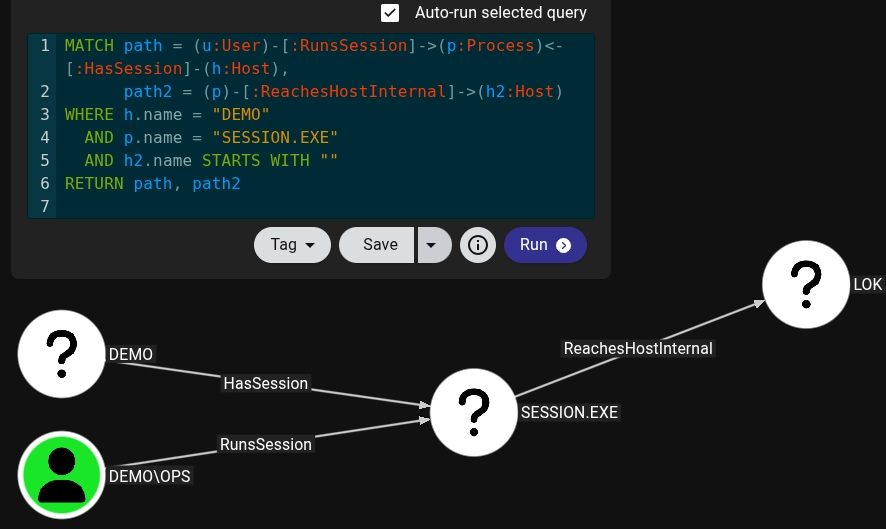
BloodHound is a great way to visualize on a directed graph which user, which process they executed, which host they used, and maps all the outgoing connections from that process. ProxyWatch has an internal collector called ProxyHound, which gathers hosts, users, processes, and endpoints. Below we see the user DEMO\OPS executed session*.exe* on host DEMO and calling out to host LOK.
Contour: Egress
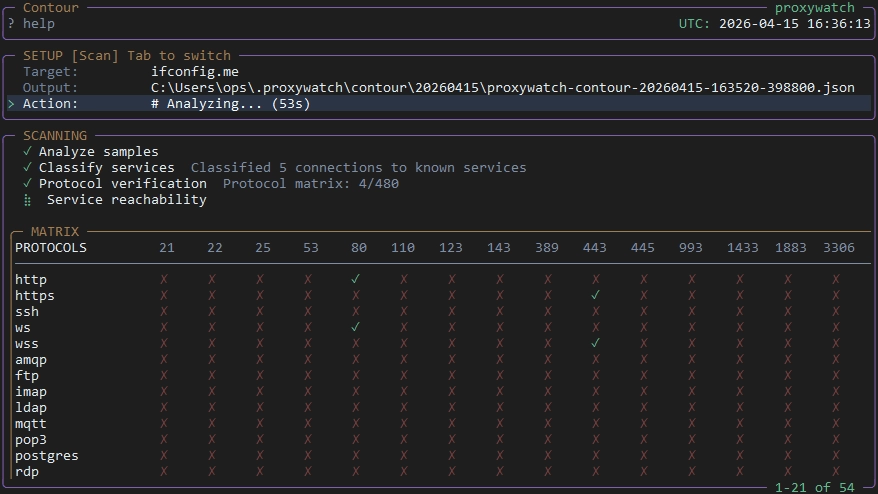
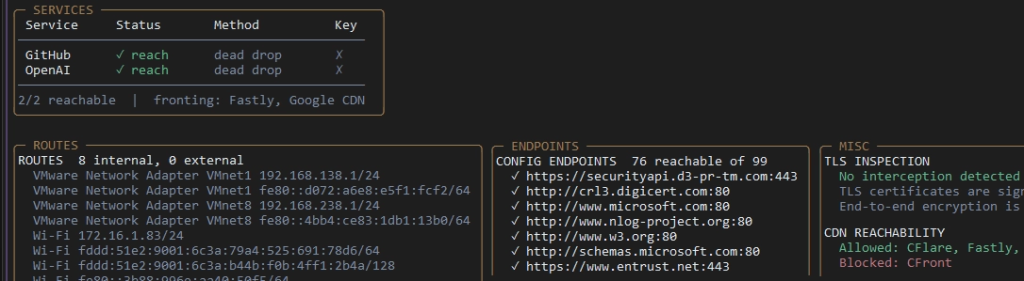
A common question during any engagement is what can actually get out of a network. Contour answers this question, by probing the egress paths from a host, identifying proxy pivots, domain fronting, DNS channels, TLS interception, and allowed HTTP methods. Defensively, it shows which tunnels and exfiltration channels the current network controls will (and will not) stop. Offensively, operators can take the same findings and stand up a working client/server SOCKS tunnel over the identified ports and protocols or utilize service dead drops to exfil data. Each scan also feeds back into the local model and Rules, so the classifier and scoring knows which ports, protocols, and services are confirmed egress paths within that network; which assists in detections. Below we see the egress scan on ifconfig.me and potential service and internal proxy egress paths.
For more information, check the Proxywatch GitHub page.


