Time Travel Debugging with Codex
Spoiler warning: this post discusses the FLARE-ON 12 `FlareAuthenticator` challenge and includes the recovered flag.
Introduction
Before getting into the technical details, this work was made possible through SpecterOps’ partnership with OpenAI’s through the Trusted Access for Cyber program. I also want to thank SpecterOps, my employer, for supporting this research and giving me time to explore, build, and test the workflow described here.
Reverse engineering sits at the center of malware analysis and vulnerability research. When an incident lands on an analyst’s desk, the source code is usually unavailable. What they get instead is an opaque executable, often packed, obfuscated, or intentionally structured to mislead the person looking at it. The reverse engineer’s job is to open the file in tools like Ghidra and a debugger, collect evidence, take notes, and slowly build a defensible explanation of what the program actually does.
Frontier models are starting to change that workflow. They can triage decompiler output, drive tools, write instrumentation, summarize findings, and keep multiple lines of investigation moving at once. But binaries are not open-source repositories: decompiled code is lossy, function boundaries can be fuzzy, control flow can be flattened, and runtime-generated state may not appear clearly in static analysis at all.
That is where LLMs can still struggle. A model may avoid outright hallucination, but still spend a long time following a path that only looks important. Anyone who has reversed a piece of malware has seen this happen: one branch looks promising; then another helper looks related; then, the next thing you know, you have a convincing theory that still does not explain what the program actually did.
For malware analysis and vulnerability research, that matters. The goal is not just to move quickly. The goal is to reduce false confidence and keep the analysis grounded in facts from the program itself. This post is about one way to do that: giving Codex access to Time Travel Debugging (TTD) traces through TTDObjectsPy, so it can query real execution history instead of reasoning only from static structure.
What Is Time Travel Debugging (TTD)?
Traditional debugging is usually a live interaction with a running process. You attach a debugger, set breakpoints, inspect registers and memory, step through code, and try to catch the interesting moment while it is happening. That works, but it also means the state is temporary. If you miss the important write, take the wrong branch, or need to compare two earlier points in execution, you often have to restart and reproduce the behavior.
TTD changes that workflow. Instead of only observing the process live, TTD records the execution of all threads into a trace. You can replay that trace forward like a normal debugger, but you can also replay it backward, deterministically. For reverse engineering and malware analysis, that is a big deal: the execution becomes something you can revisit, share, and query instead of something you have to perfectly catch in the moment.
There is also a common misconception that TTD is only useful inside the WinDbg UI. WinDbg is the most visible way people encounter it, but the replay engine can be driven programmatically. One approach is to use the WinDbg Data Model APIs, such as `dx @$cursession.TTD.*`, but that still leaves you with the overhead of managing a debugger session in the background. Another approach is to work directly with the replay components that open and parse captured traces.
Fortunately, Microsoft also provides a documented NuGet SDK for the Time Travel Debugging APIs. TTDObjectsPy builds on that path: it wraps the TTD replay functionality and exposes it as MCP tools and Python helpers that Codex can use directly. I will not go deep into the implementation details here; the important part is what it gives the model during analysis.
Instead of treating execution as temporary, TTDObjectsPy lets Codex treat the trace as a searchable database of what actually happened:
– Which address executed?
– What were the registers?
– What memory changed?
– Which instruction wrote this value?
– Which function received this argument?
– What did the program compare before it accepted or rejected input?
The short version is that TTDObjectsPy lets an LLM open existing traces, move to specific points in time, inspect register and memory state, query function calls, and perform basic data-flow analysis. That gives Codex a way to ground its reasoning in execution history instead of relying only on static structure.
The Target
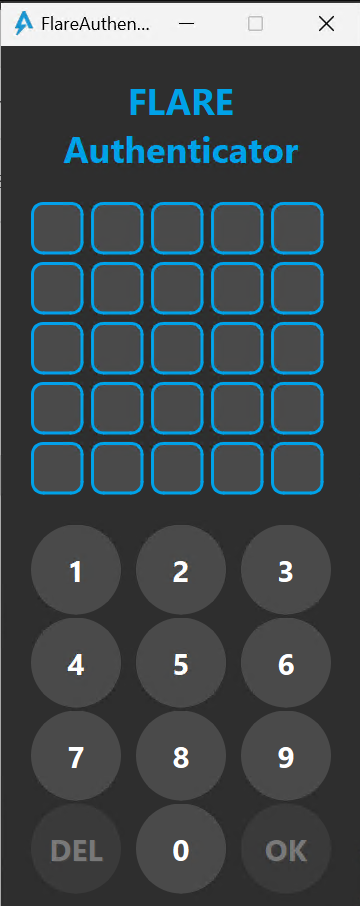
To demonstrate this, we used `FlareAuthenticator` from FLARE-ON 12, an annual reverse-engineering and malware-analysis competition originally hosted by FireEye Labs Advanced Reverse Engineering (FLARE) and later by Google Cloud. It is a Windows Qt GUI challenge with a keypad-style authenticator. The user enters a 25-digit code, clicks `OK`, and the program either rejects it or shows the flag.
The correct submit path is heavily flattened, and the real validation state is hidden behind runtime behavior. That made it a good target for this experiment. A static-only agent can still make progress, but it has to fight the obfuscation directly. A TTD-enabled agent can instead ask: what actually happened when the button was clicked?
Experiment Setup
To compare the workflows, I ran two local Codex sessions against the same challenge using the GPT-5.4-Cyber model in Fast Mode. One session had TTDObjectsPy enabled, and the other had
all TTD-related tooling disabled in `config.toml`.
Both sessions were given the same goal: solve the `FlareAuthenticator` challenge and recover the flag ending in `@flare-on.com`. Neither session was allowed to look up online writeups or challenge solutions. Both were run with a one-shot prompt and no follow-up user interaction, so the result depended on the tools and reasoning available inside that session.
To avoid leaking information between attempts, the Ghidra-only session ran first. That session could use static analysis, local execution, instrumentation, and other non-TTD tools. The second session had the same baseline capabilities, but also had access to TTDObjectsPy and could record and query Time Travel Debugging traces.
Codex Without TTD
The first Codex session had TTD explicitly disabled. The prompt prohibited `TTD.exe`, `TTDReplay`, TTDObjectsPy, TTD traces, and TTD MCP tools.
We monitored the session during execution and noticed that Codex did a lot of useful work: It identified the binary as a self-contained Qt GUI app, mapped the keypad UI, found the relevant Qt slots, and used Ghidra plus Frida to observe the submit path. It also located the success and failure message-box paths and tried to reason around the flattened control flow.
The problem was that the evidence was indirect. Codex eventually forced execution down a success-looking path and used a partial visual clue to infer the flag text. The final answer looked plausible. It even had the right style for a FLARE-ON flag. But it was wrong. Here is the token and time spent for this session.
Task duration: 1:51:28.706

Total tokens: 69,501,208

Result: incorrect flag
Codex With TTDObjectsPy
The second Codex session had TTDObjectsPy enabled. It started the same way by inspecting the binary in Ghidra and mapping the Qt slots, but then it used traces instead of trying to fully untangle the flattened submit function. The trace correlated button clicks to the digit, `DEL`, and `OK` handlers, then showed the real check: the `OK` handler reads a 64-bit state field at `window+0x78` and compares it against `0x0bc42d5779fec401`.
That changed the problem. Codex only needed to learn how the keypad changed that one state field. The trace showed that the digit handler updated the rolling state at runtime offset `+0x16b00`, where `r9` already held the per-press contribution for the current digit and position. Codex captured controlled digit traces, extracted the 25-by-10 delta table, solved the exact sum constraint with OR-Tools CP-SAT, and got:
4498291314891210521449296Codex replayed that passcode into the unmodified GUI. This time, there was no forced success path and no inferred screenshot text. The application accepted the code and returned the real flag:
s0m3t1mes_1t_do3s_not_m4ke_any_s3n5e@flare-on.comTTD traces captured: 5
Task duration: 50:04.146
Total tokens: 16,435,280
MCP calls: 48 Ghidra calls, 120 TTD calls
Result: correct flagAfter inspecting the session logs, the difference became clear. In the no-TTD session, Codex spent most of its effort working around flattened control flow with decompiler output, Frida hooks, UI automation, screenshots, branch patching, and a lot of reasoning. It built a path toward the success message, but that path still depended on inference.
In the TTDObjectsPy run, Codex used the trace as ground truth and asked narrower questions: what code runs when a keypad button is clicked, what runs when `OK` is clicked, what state the submit handler compares, where that state is updated, and what each digit contributes at each position. Once those answers existed, the challenge stopped being a large, ambiguous reverse-engineering problem and became a small, verifiable data-extraction problem followed by constraint-solving.
The Caveats
This is a case study, not a benchmark suite. It is one challenge, on one machine, using two local Codex sessions. The numbers are still useful, but they should not be read as a universal claim that TTD always cuts reverse-engineering time by the same amount.
The token counts are total logged tokens, including cached input tokens. The non-cached token gap is smaller than the headline number. Still, total token usage is a useful proxy here because it reflects how much context the sessions carried through repeated tool-heavy loops.
TTD also has real operational overhead. Recording traces takes disk space. Capture can fail. GUI automation can race the application. Large traces have to be cleaned up carefully. In the TTDObjectsPy run, some of the work was not glamorous reverse engineering; it was making trace capture reliable enough to extract clean data.
So the takeaway is not “always use TTD for everything.” The takeaway is more specific: when the important behavior is runtime-dependent, giving Codex queryable execution history can keep it grounded and prevent long speculative detours.
Conclusion
LLMs can be very useful in reverse engineering, but they need the right kind of evidence. Static analysis tools let Codex move quickly through a binary, but static structure can still leave too much room for plausible wrong stories.
TTDObjectsPy changes the workflow by giving Codex access to recorded execution as evidence. In this challenge, that shifted the problem from, “patch and infer the success path” to, “extract the real validation state and solve it directly.”